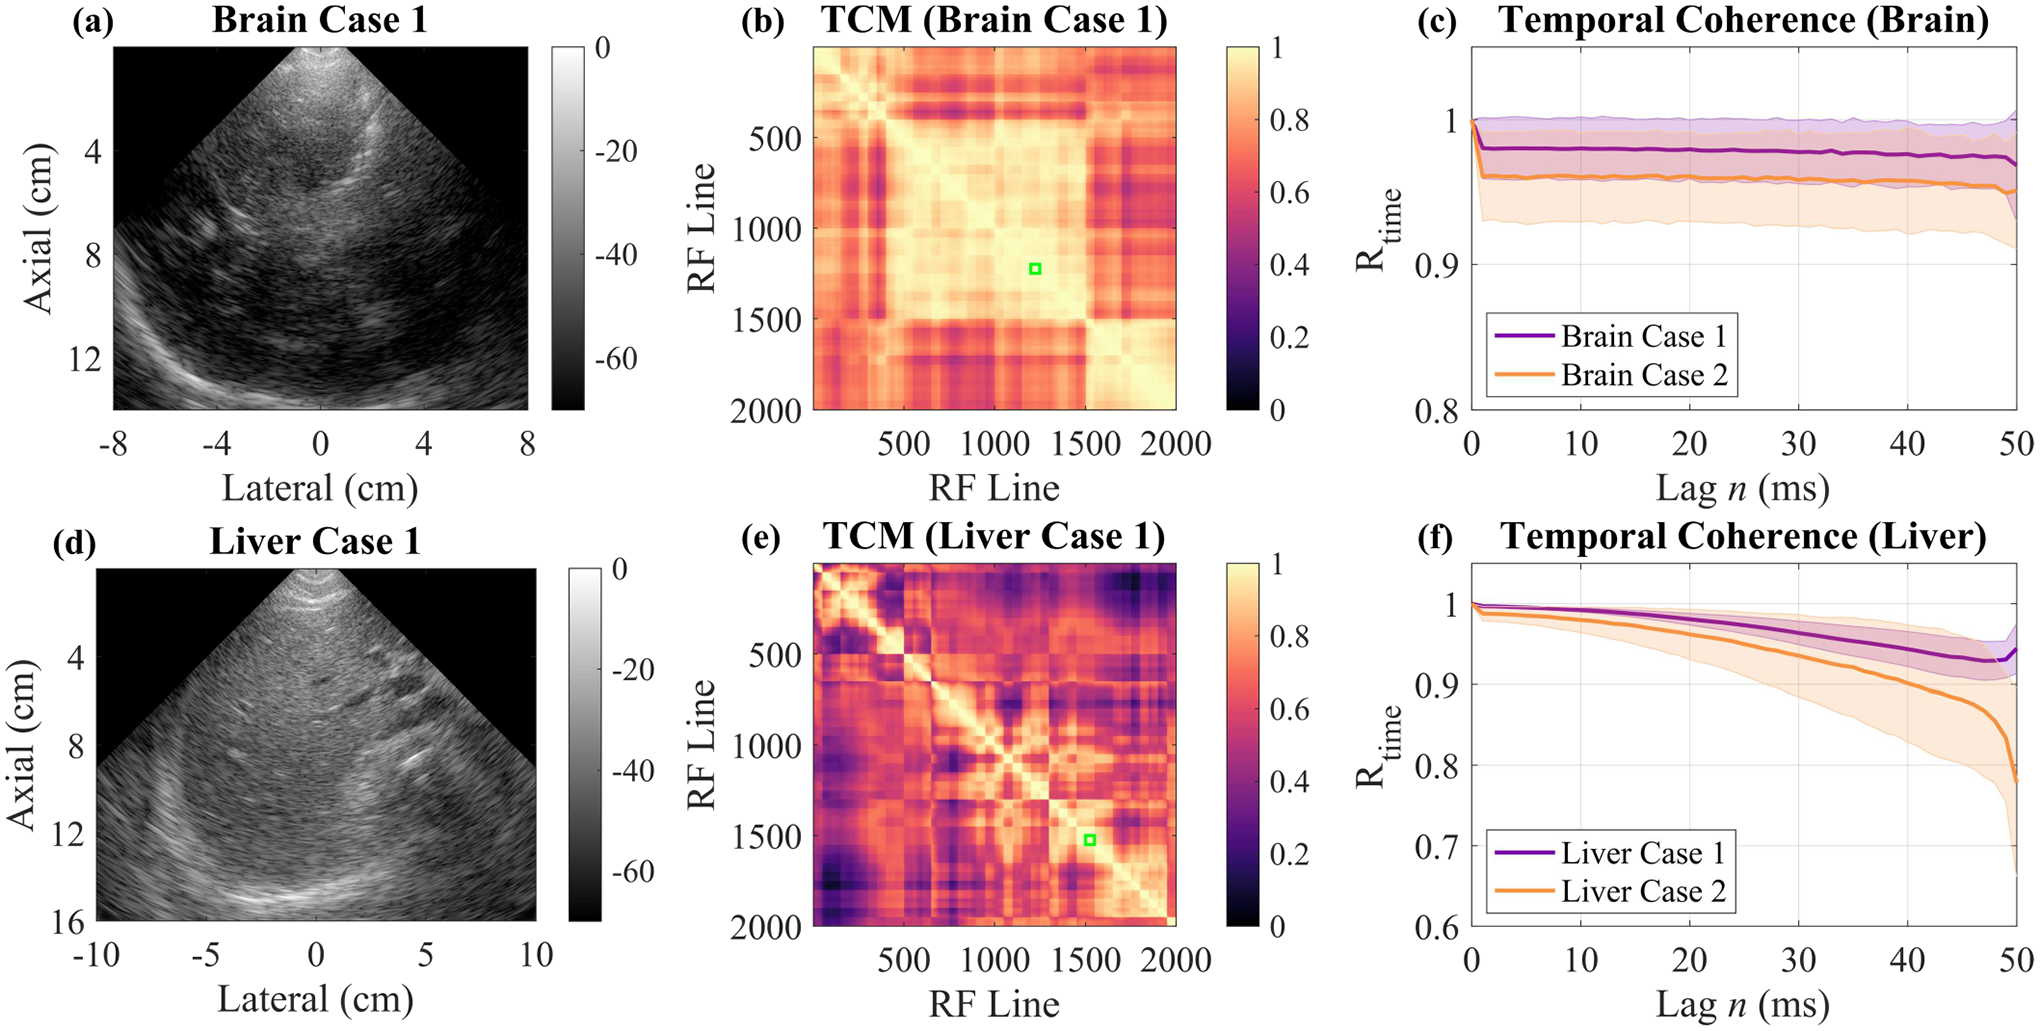
Fig. 8.

In vivo case studies investigating the effects of motion on temporal coherence in two representative imaging environments, the brain (a)-(c) and the liver (d)-(f). (a) B-Mode of brain imaging Case 1. (b) Temporal Correlation Matrix (TCM) for the M-Mode acquisition for Brain Case 1. Green box indicates the 50 RF line ensemble with maximal correlation which was used to calculate temporal coherence. (c) Temporal coherence curves for the two Brain Cases calculated over their respective 50 RF line ensembles with maximal coherence. (d) B-Mode of the liver imaging Case 1. (e) Temporal correlation matrix for the M-Mode acquisition for Liver Case 1 with the green box indicating the 50 RF line ensemble with maximal correlation. (f) Temporal coherence curves for the two liver cases calculated over their respective 50 RF line ensembles with maximal coherence.
