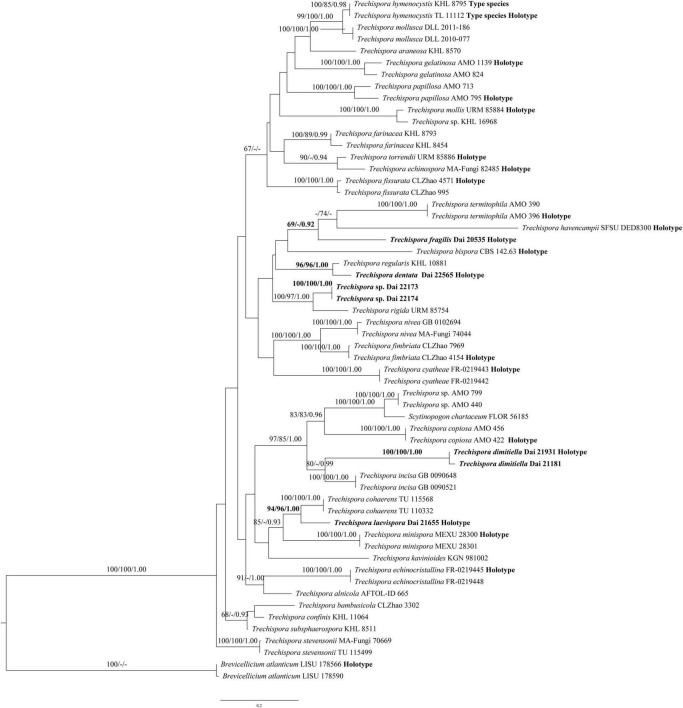
FIGURE 2.
Phylogeny of Trechispora generated by ML analyses based on combined ITS sequences. Branches are labelled with ML BT >65%, Parsimony Bootstrap Proportions >70%, and BPP >0.90, respectively. Putatively new species, the sequence origin from the holotype, and the type status of the species in the genus are indicated in bold.

