. 2018 Aug 6;8(49):27924–27934. doi: 10.1039/c8ra05298k

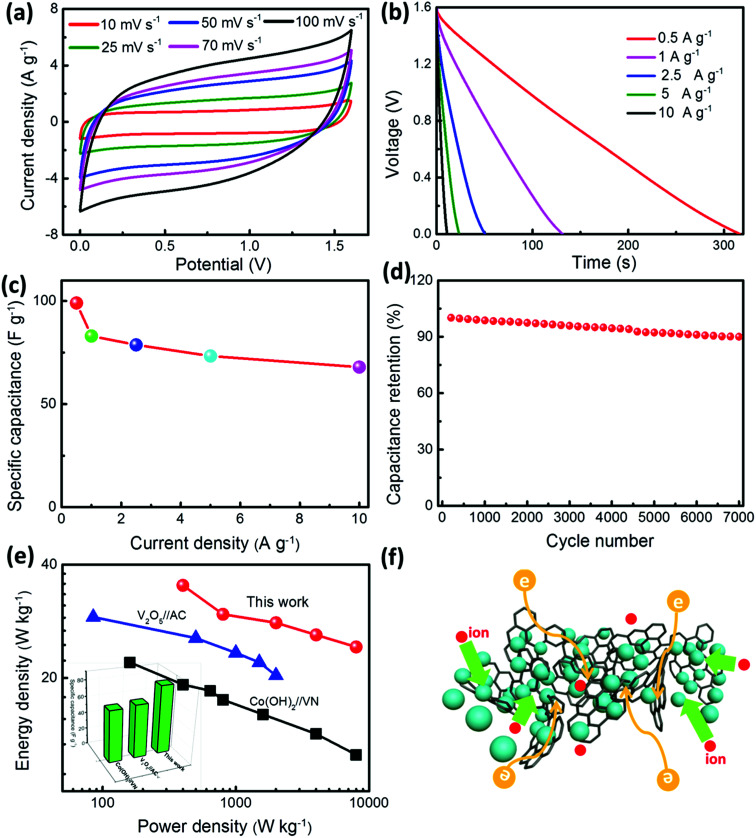
Fig. 7. (a) CV curves of the as-fabricated HSCs measured at different sweep rates from 0 to 1.6 V. (b) Galvanostatic discharge curves collected at different current densities. (c) Specific capacitance calculated from discharge curves as a function of the current density. (d) Cycling performance at a constant current density of 10 A g−1. (e) Ragone plots of our HSCs in comparison with previously reported HSCs based on vanadium-based electrode materials with aqueous electrolyte (blue plots,44 black plots,16), inset image is the corresponding specific capacitance of these HSCs calculated from discharge curves at current density of 1 A g−1. (f) Schematic of intimate between the VN or V2O5 nanospheres and graphene facilitating rapid charge and electrolyte transport.

Fig. 7