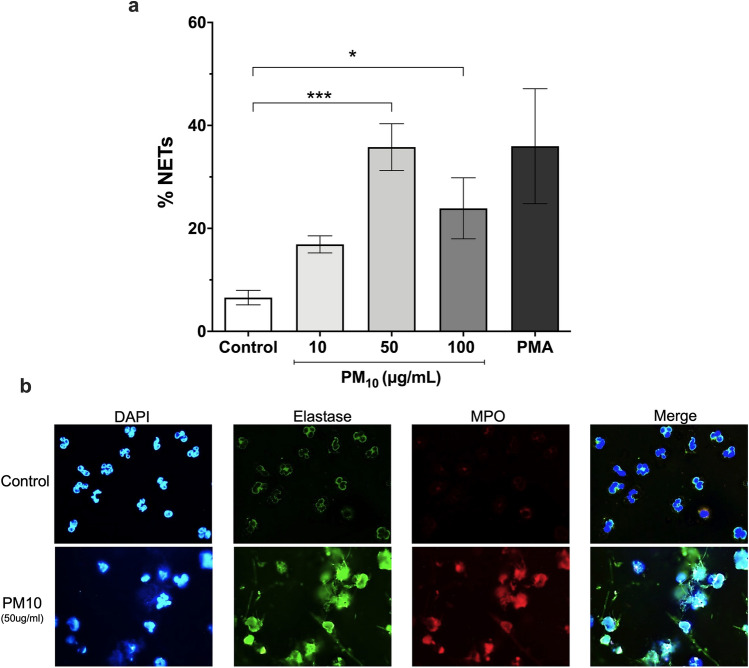
Figure 3.
NETs formation in PMNs exposed to PM10. PMNs were exposed to 10, 50, and 100 μg/mL PM10 for 3 h. Negative control (culture medium); positive control (PMA). (a) NETs release was analyzed microscopically, and MPO, NE, and DNA were quantified with ImageJ software. (b) Representative fluorescence microscopy images of NETs. Images show colocalization of MPO (red), NE (green) with DNA fibers released (blue) from released NETs. All data are represented as mean ± SEM of 9 healthy donors. *p < 0.05; ***p < 0.001 by Kruskal–Wallis analysis with Dunn's post hoc test.

