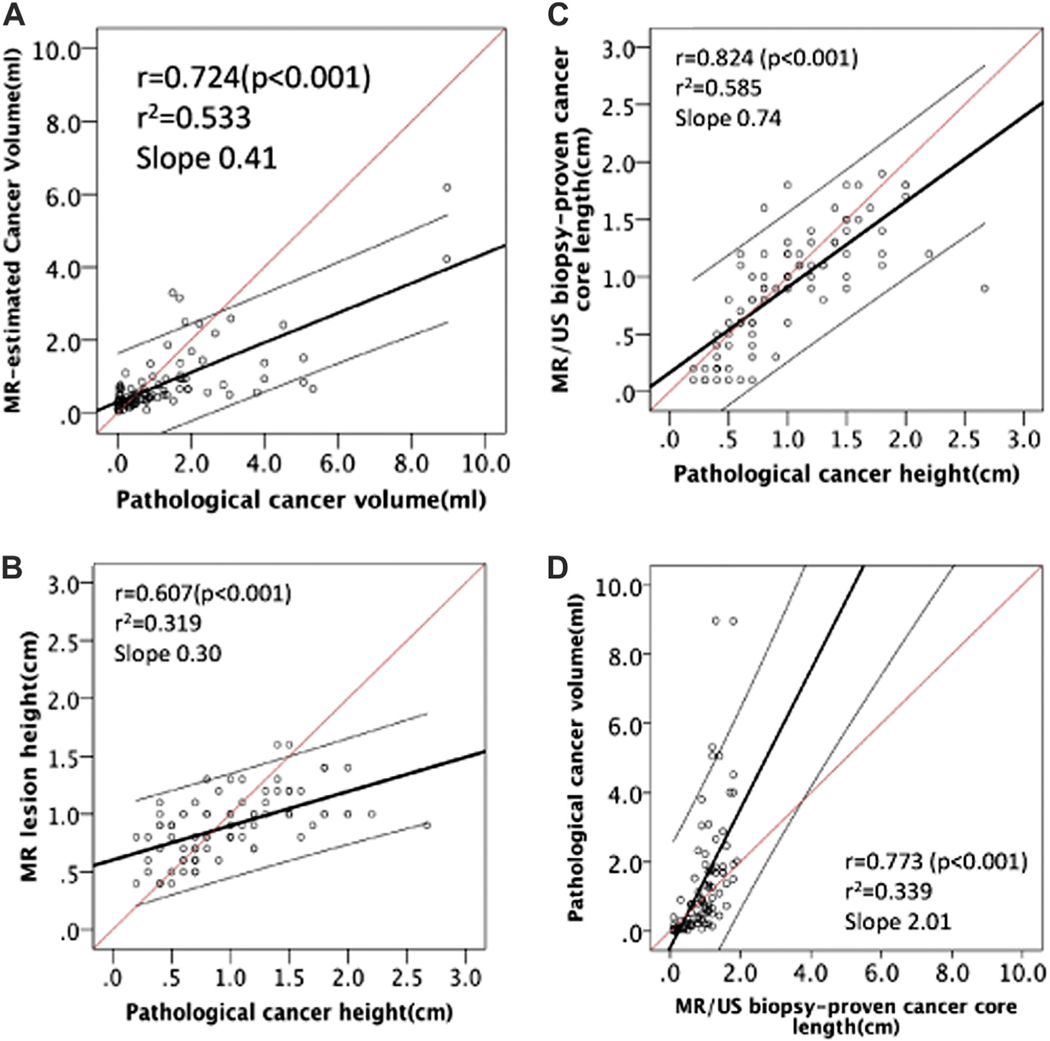
Figure 3.
A, MCV significantly correlated with PCV (r = 0.724, r2 = 0.533, p <0.001). B, correlation between pathological cancer height (AP dimension) and MRI lesion height (AP dimension) (r = 0.607, r2 = 0.319, slope 0.30, p <0.001). C, correlation between pathological cancer height (AP dimension) and MR/US biopsy proven cancer core length (r = 0.824, r2 = 0.585, slope 0.74, p <0.001). D, correlation between PCV and MR/US biopsy proven cancer core length (r = 0.773, r2 = 0.339, slope 2.01, p <0.001). Red line represents predicted ideal. Black line indicates identified line. Gray lines represent 95% CI.

