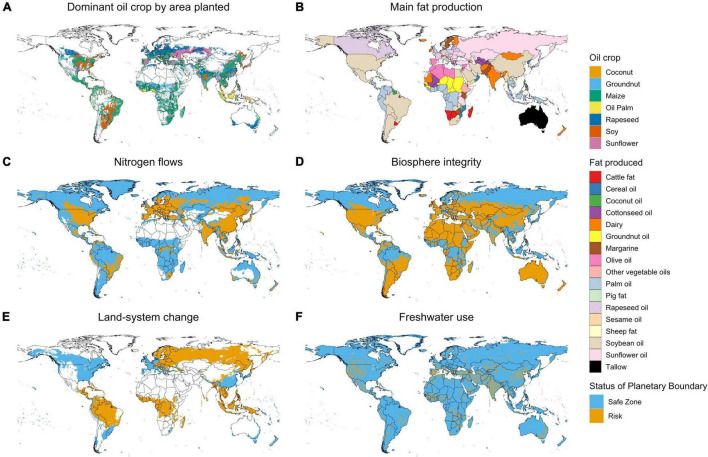
FIGURE 2.
(A–F) The status of planetary boundaries for nitrogen flows, biosphere integrity, land-system change and freshwater use compared to the main oil crop and fat production areas. For details on data and methods used for maps refer to Supplementary Materials.

