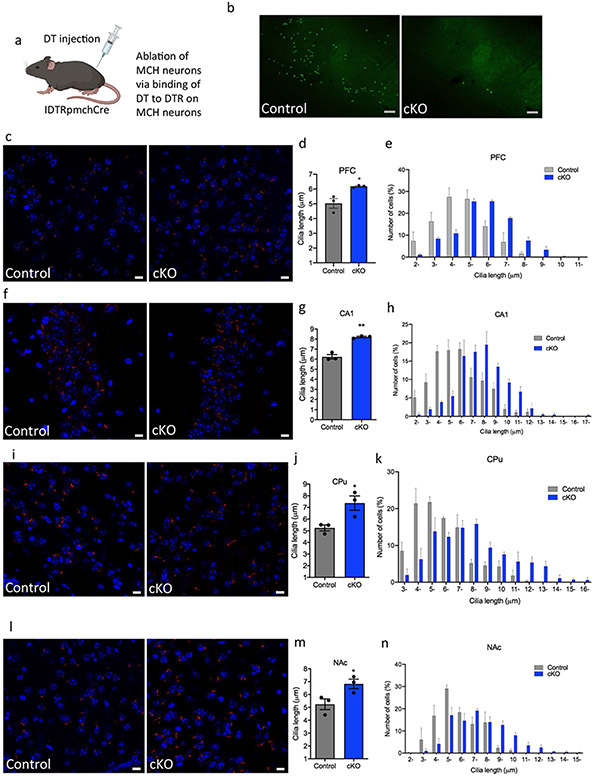
Fig. 6.
Cilia length is increased in MCH deficit mice. a Schematic representation of how the MCH cells are ablated through DTR. IDTR mice were crossed with PmchCre mice rendering offspring mice with Cre-expressing MCH neurons sensitive to DT. Diagram was created with BioRender.com webpage. b MCH immunoreactivity (GFP) in the lateral hypothalamus of IDTRPmchCre− and IDTRPmchCre + mice following DT injection (scale bar = 100 μm, magnification = 10 ×). c, f, I, l Immunostaining of ADCY3 labeled in red fluorescence and counterstained with DAPI (blue) in IDTRPmch + and IDTRPmch− mice in the c PFC, e CA1, g CPu, and i NAc (scale bar = 10 μm, magnification = 63 ×). d, g, j, m Quantification of cilia length (μm) in the d PFC, f CA1, h CPu, and j NAc, *P < 0.05 and **P < 0.01. e, h, k, n Cilia were grouped by length (μm) and plotted against the number of cells (%) in the e PFC, h CA1, k CPu, and n NAc

