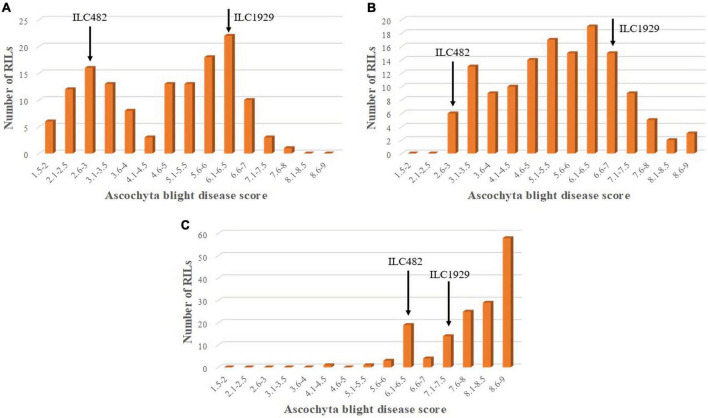
FIGURE 2.
Frequency distribution of AB disease scores in 135 RILs of the AB482 chickpea population developed from a cross between “ILC1929” and “ILC482.” Mean disease score was used to calculate the frequency distribution of disease scores in the greenhouse experiment repeats for pathotype I under (A) field conditions at Kfarshakhna in 2015 and (B) at PAU Ludhiana in 2017. (C) Arrows show the mean scores of the resistant “ILC482” and susceptible “ILC929” parents.

