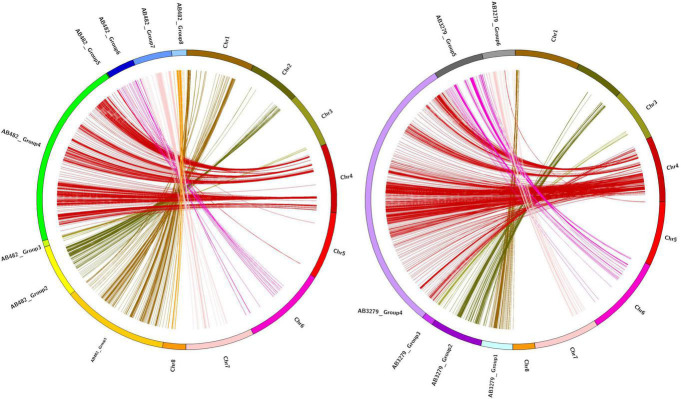
FIGURE 3.
Chromosomal distribution of single nucleotide polymorphism (SNP) markers in the chickpea genome, where (A) is the density of the AB482 population (per 1 Mbp), (B) is the density of the AB3279 population (per 1 Mbp), and (D) is the marker logarithm of odds (LOD) score (red points) only for AB3279.

