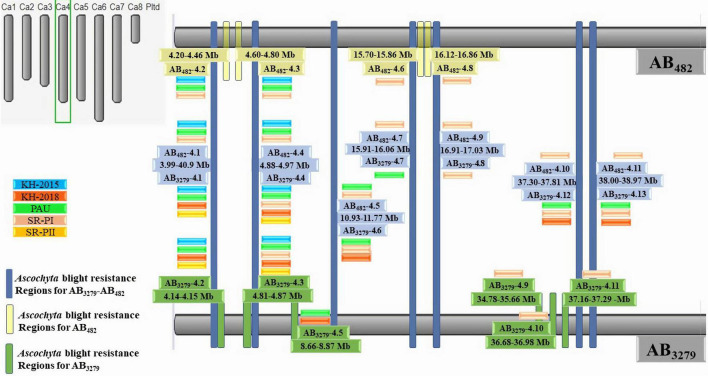
FIGURE 5.
High-density intraspecific genetic map of chickpea (ILC482 × ILC1929) using genotyping-by-sequencing (GBS)-SNP markers. Bars in dark blue color font are the common genomic regions in both populations AB3279 and AB482, bars in yellow color font are genomic regions in AB482. Bars in green color font are genomic regions in AB3279.

