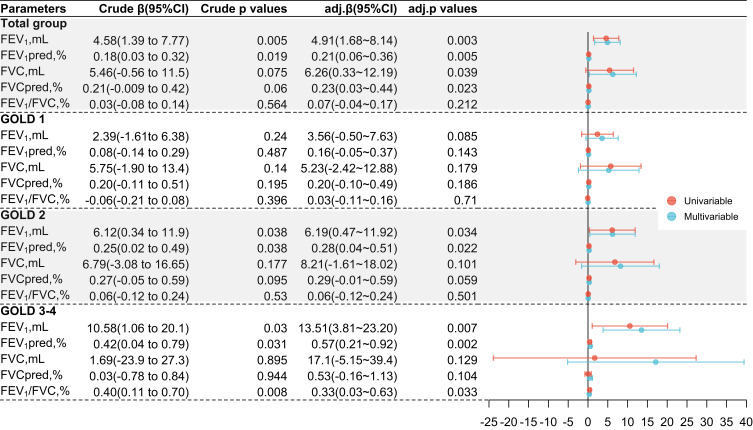
Figure 2.
Linear regression analysis for the relationship between bilirubin and annual lung function decline, by overall COPD population and stratified by GOLD stages.
Notes: Annual Lung function decline was calculated as the parameters at follow-up minus corresponding baseline values divided by the number of years for follow-up duration. Multivariable linear regression analysis models were adjusted for age, sex, BMI, smoking status, smoke index, passive smoker, occupational exposure, comorbidities and family history of respiratory diseases. Per unit increase of TB in all these models is 1 μmol/L. Crude β means the unstandardized β estimate from univariable analysis, Crude P values mean the P values from univariable analysis, adj.β means the unstandardized β estimate from the multivariable analysis, adj.P values mean the P values from multivariable analysis. Abbreviations see abbreviation section in Table 1.

