Figure 4.
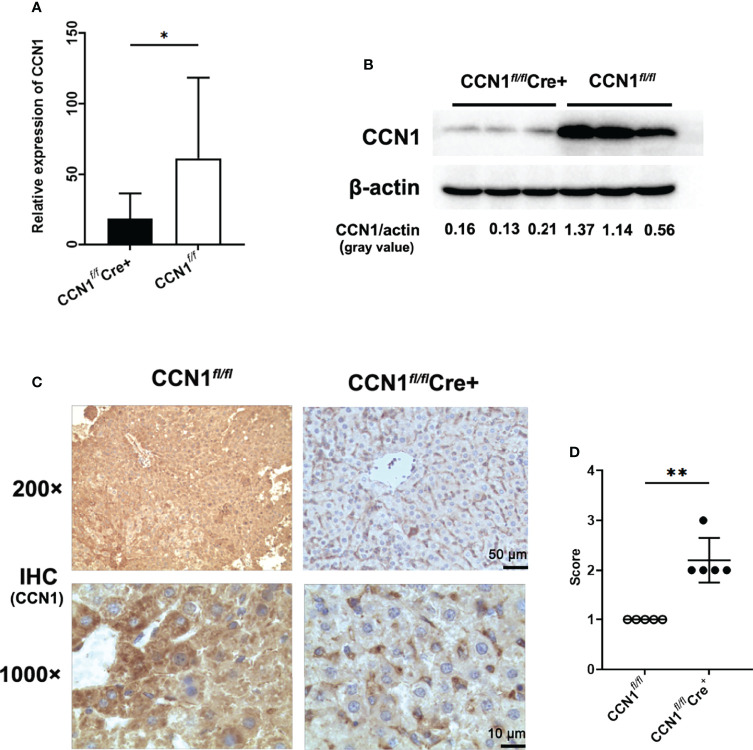
Construction and identification of CCN1 conditional knock out mice. (A) mRNA expression of CCN1 in hepatocytes of CCN1 fl/fl Cre+ and CCN1 fl/fl mice determined by real-time PCR. (B) CCN1 protein level in hepatocytes of CCN1 fl/fl Cre+ and CCN1 fl/fl mice detected by Western blot. The relative expression of CCN1 protein was expressed by gray value. (C) IHC staining images of CCN1 in liver tissues from CCN1 fl/fl Cre+ and CCN1 fl/fl mice. Original magnification ×200 (upper, scale bar: 50 µm), ×1000 (bottom, scale bar: 10 µm). (D) Quantification of IHC staining for CCN1 in mice liver using IHC profiler. The IHC score was expressed as described in methods section. Original magnification ×200 (upper), ×1000 (bottom). *p<0.05, **p<0.01.

