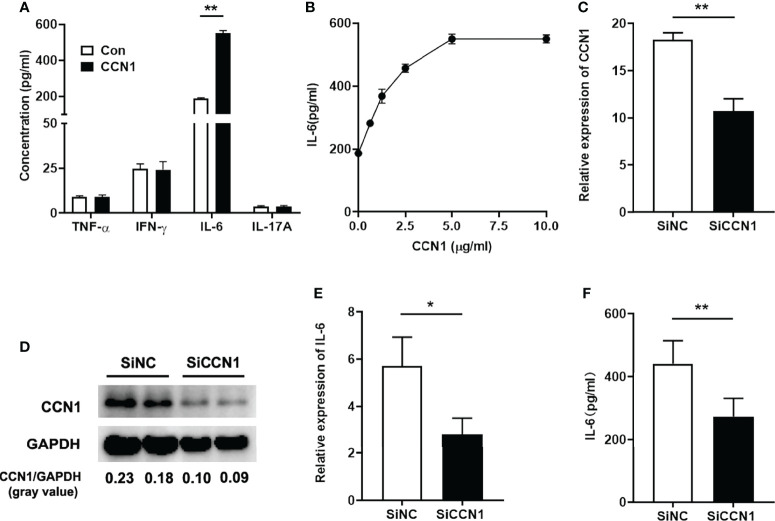
Figure 6.
CCN1 induced IL-6 production in LO2 cells. (A) IFN-γ, IL-17, IL-6 and TNF-α concentration in supernatant of LO2 cells stimulated by CCN1 (5 μg/ml). (B) IL-6 concentration in supernatant of LO2 cells stimulated by CCN1 (2.5, 5, 7.5, 10μg/ml). (C) CCN1 mRNA expression in CCN1-knockdown LO2 cells. (D) CCN1 protein expression in CCN1-knockdown LO2 cells. The relative expression of CCN1 protein was expressed by gray value. (E) IL-6 mRNA expression in LO2 cells treated with SiCCN1 (small interfering RNA against CCN1, black bar) or SiNC (small RNA of negative control, open bar). (F) IL-6 level in culture supernatant of LO2 cells treated with SiCCN1 or SiNC. *p<0.05, **p<0.01. All experiments were independently repeated at least three times in triplicate.

