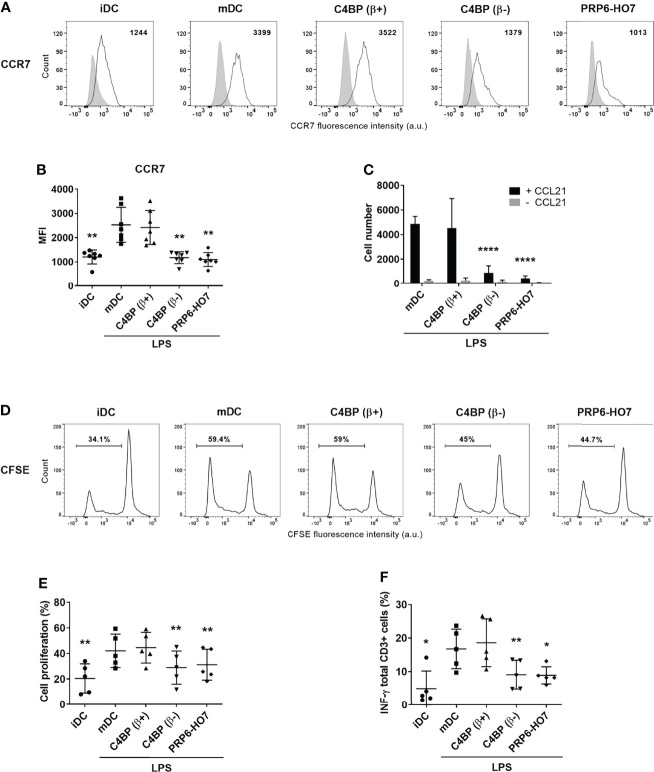
Figure 7.
|PRP6-HO7 down-regulates CCR7 expression, alters the chemotaxis, and prevents T cell alloproliferation and IFN-γ production in Mo-DCs. CCR7 expression analysis of Mo-DCs at translational level. Representative histograms displaying CCR7 surface expression (A), and its quantification (B) on C4BP(β+)-treated, C4BP(β-)-treated (both at 12 nM), and PRP6-HO7-treated (32 nM) and LPS-matured DCs. Isotype control is shown in gray. The MFIs for CCR7 cell surface expression are indicated. Results shown are the mean ± SD from 7 independent donors. (C) Migration of untreated, C4BP(β+)-treated, C4BP(β-)-treated (both at 12 nM), and PRP6-HO7-treated (32 nM) DCs towards the chemokine CCL21 after LPS maturation was assessed in a transwell assay. Shown are the absolute numbers of LPS-matured DCs (mDC) migrated toward the lower CCL21-containing chamber after 2 h incubation (black columns). Spontaneous migration of DCs towards a lower chamber without CCL21 was also assessed (grey columns). Results are the mean ± SD from 7 independent donors performed in duplicate. Allogeneic CD3+ T cells were labeled with the CSFE dye and co-cultured with C4BP(β+)-treated, C4BP(β-)-treated (both at 12 nM), and PRP6-HO7-treated (32 nM) and LPS-matured DCs at 1:5 DC:T cell ratio. (D) Histograms from one representative experiment indicating the percentage of proliferating cells that have lost the CSFE dye. (E) Quantification of the percentage of T cell proliferation. (F) Percentage IFN-γ production by CD3+ T cells. Results shown are the mean ± SD from 5 independent donors. iDC, untreated, immature DCs; mDC, untreated, LPS-matured DCs (*p < 0.05; **p < 0.01; ****p < 0.0001 compared with mDC).

