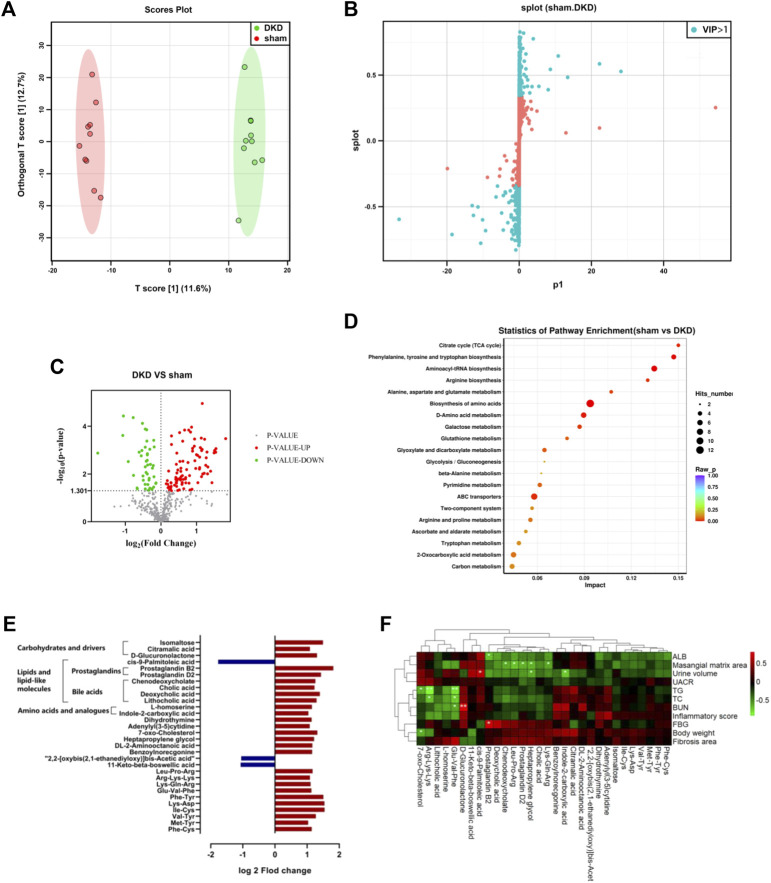
FIGURE 2.
Significantly altered circulating metabolic profile in the DKD group. (A) OPLS-DA plots with scores of the first two principal components. (B) S-plots of the OPLS-DA model from sham and DKD rats. (C) Volcano plot of the different metabolites obtained according to the screening criteria from sham and DKD rats. (D) Bubble plot of the KEGG pathway enrichment analysis of 315 markedly different metabolites. (E) Further screening from differential serum metabolites according to the following condition: log2 fold change>1 or < −1. (F) Correlation analysis between base parameters related to DKD, semi-quantification of renal damage, and 30 differential serum metabolites using Spearman’s rank correlation (*p < 0.05, **p < 0.01).

