
Extended Data Fig. 7. The saturation model accurately predicts the cell culture positivity data.
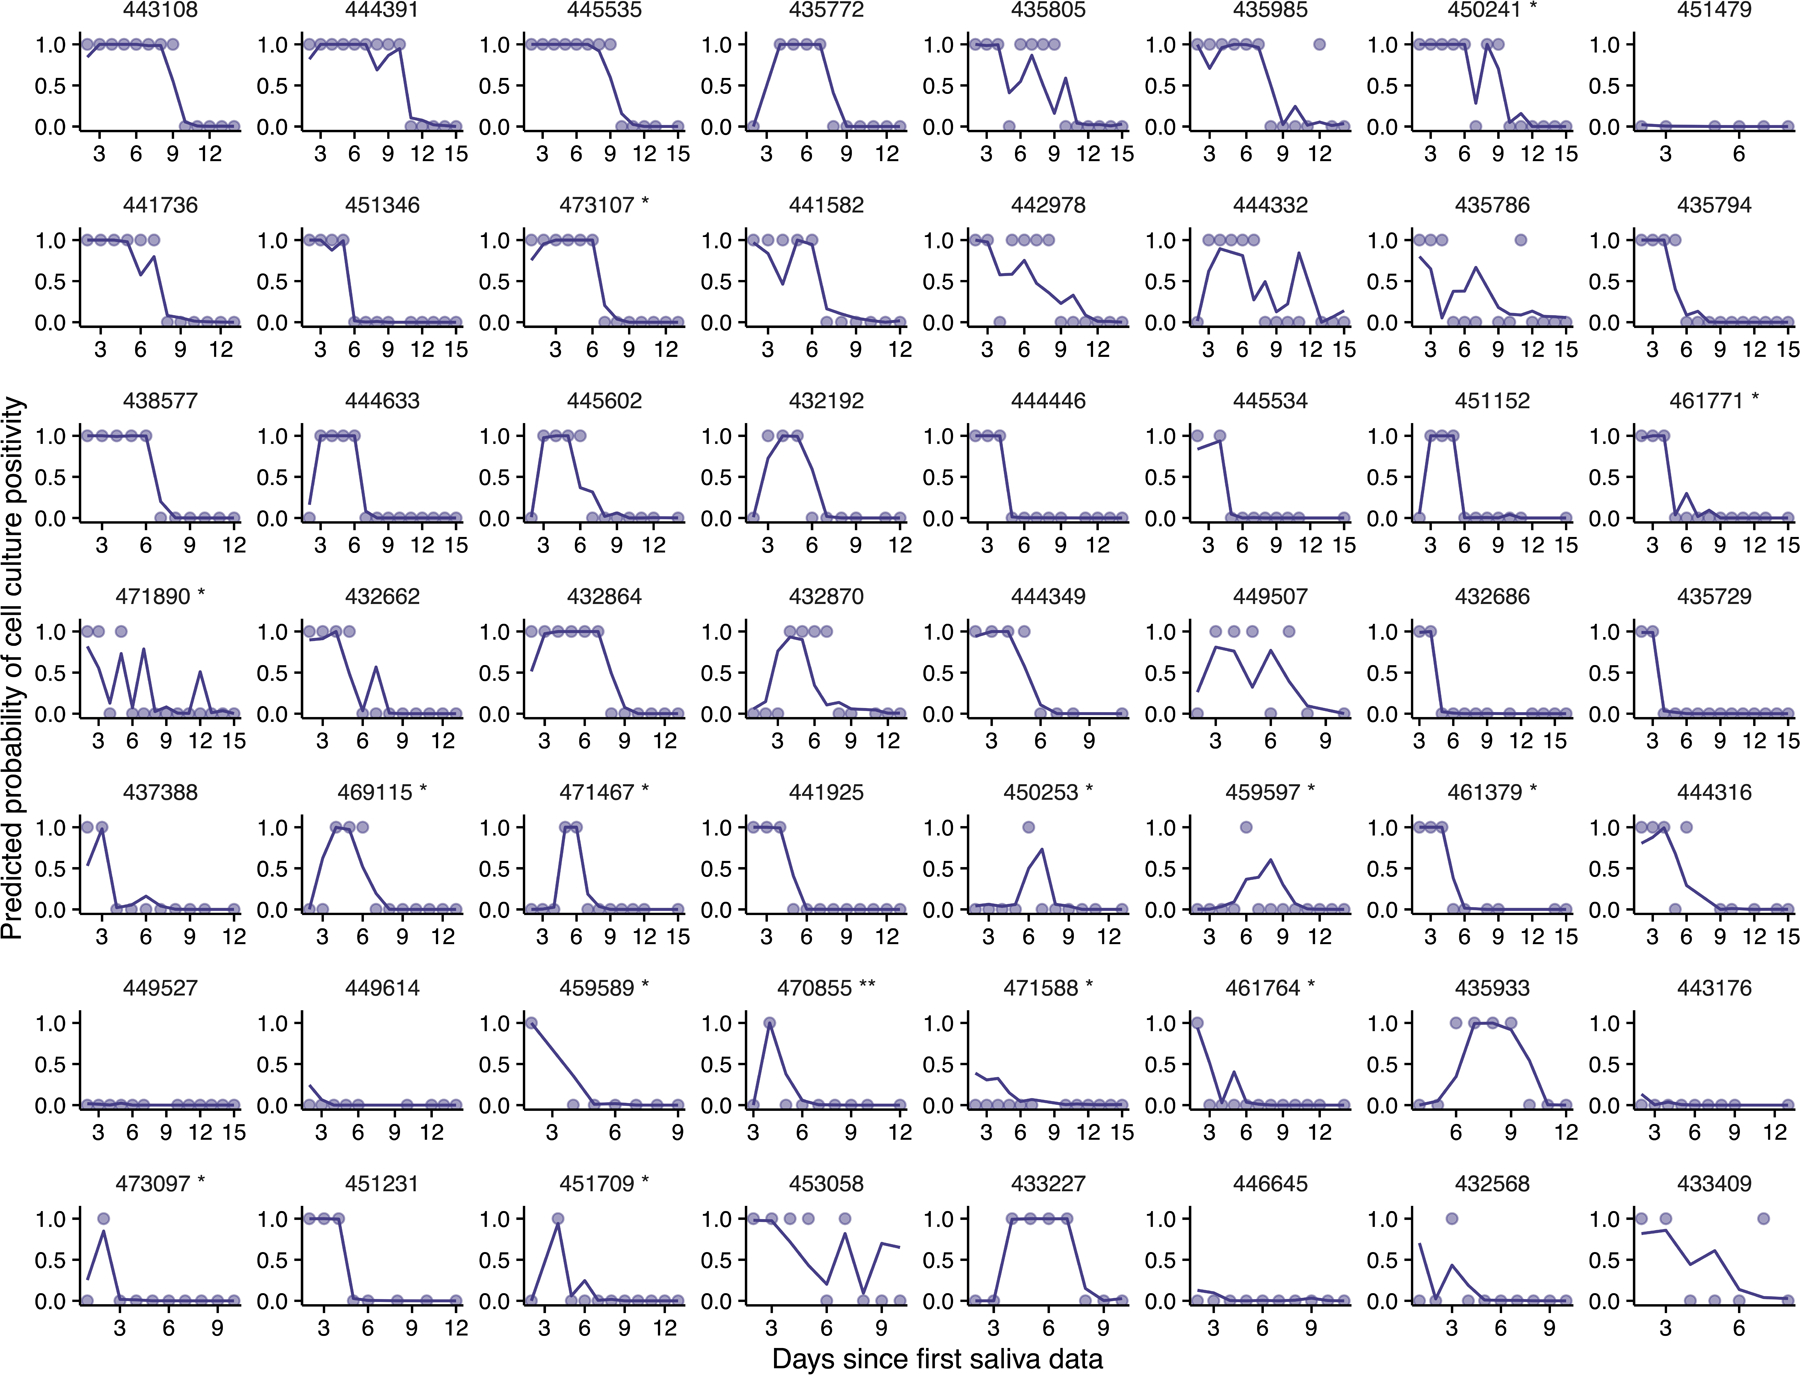
Lines denote the predicted probability of cell culture being positive. Dots denotes cell culture positivity data, where a dot is at 1 or 0 when the cell culture is positive or negative, respectively.