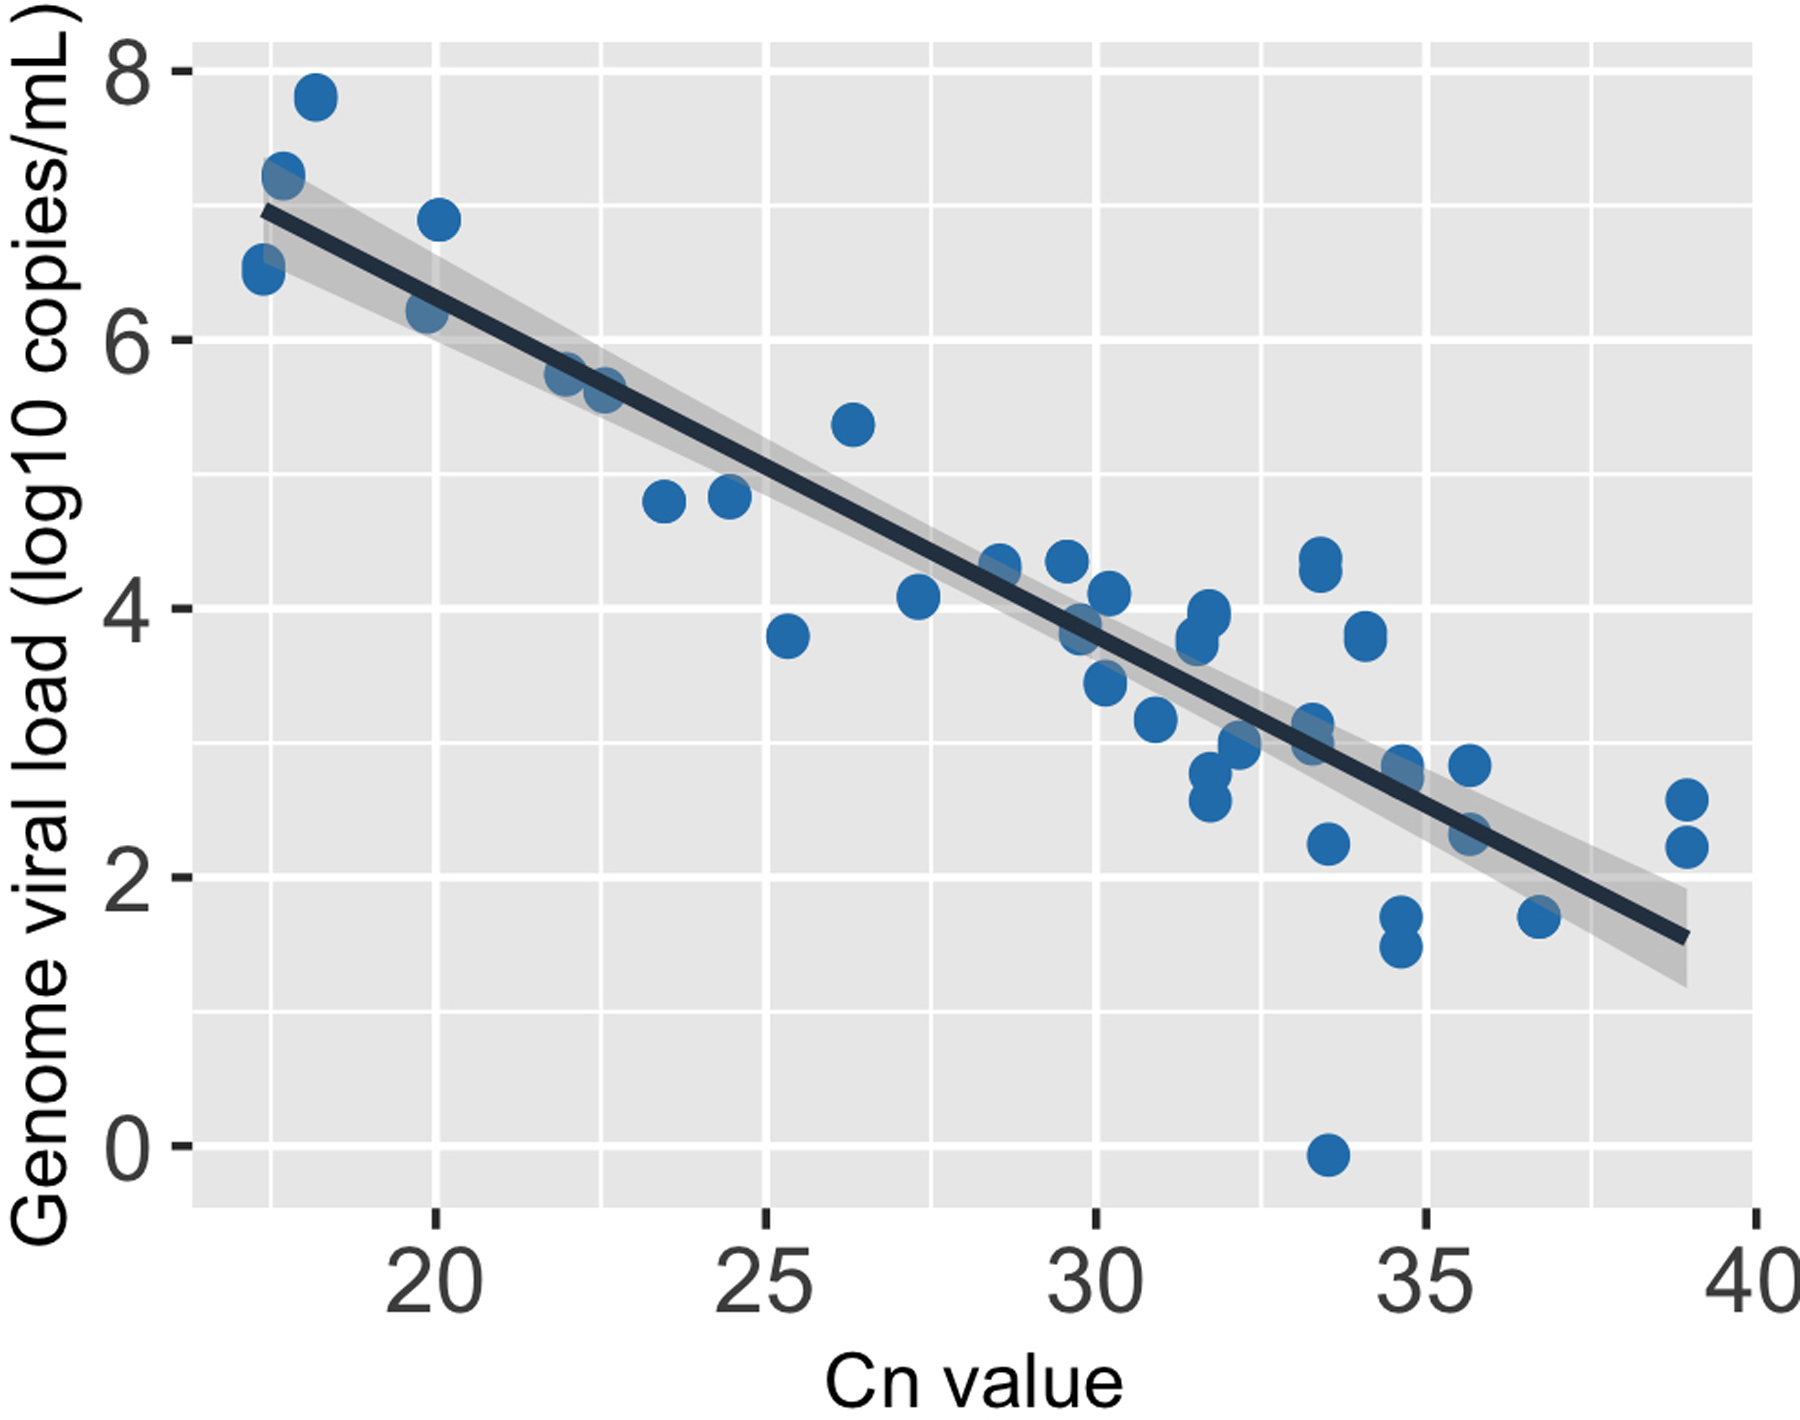
Extended Data Fig. 9. The relationship between genome viral load (y-axis; on a log10 scale) and CN value of the nasal samples.

The black line, i.e. the center of the error band, represents the linear regression calibration curve. The shading around the black line shows the standard error for the regression.
