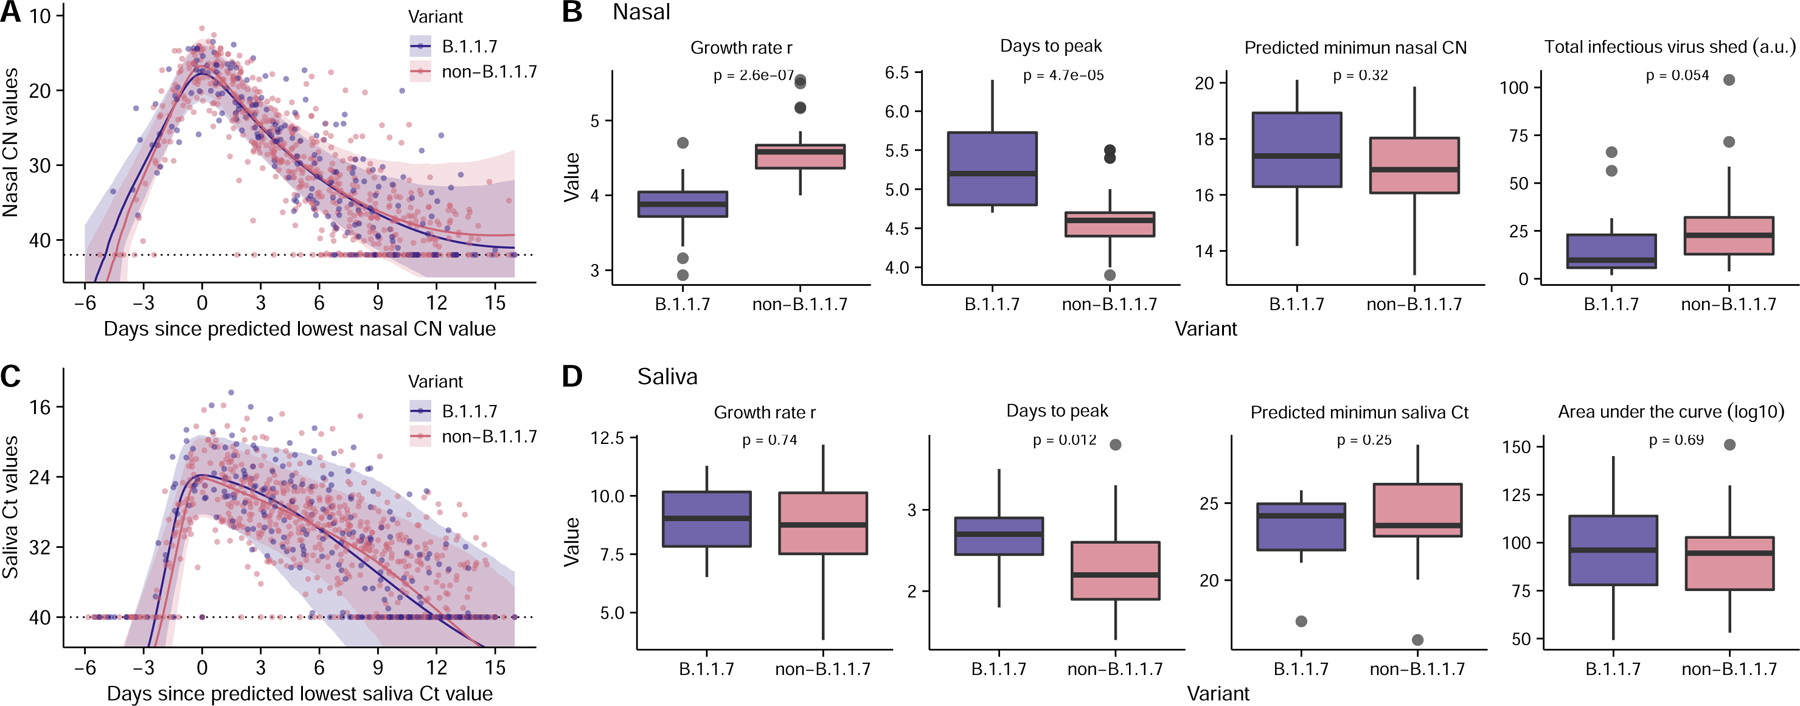
Figure 4: Comparison of viral dynamics between B.1.1.7 and non-B.1.1.7 viruses.

(A, C) Viral genome load of B.1.1.7 infections (purple) and non-B.1.1.7 infections (pink) over time in (A) nasal and (C) saliva samples, as measured by RTqPCR (Dots). Ribbons indicate 90% confidence intervals of predicted CN and Ct value trajectories respectively using population parameters estimated from modeling analysis (Table S4). (B, D) Comparison of estimated values for the indicated summary statistics of viral dynamics between individual B.1.1.7 and non-B.1.1.7 infections. (n=14 and 42 for B.1.1.7 and non-B.1.1.7 infections, respectively). The boxes of the boxplots start in the first quartile and ends in the third quartile of the data (e.g., interquartile range IQR), and the line inside the box represents the median. The whiskers represent 1.5 x the IQR, and the closed circles represent outliers. The p-values for the Wilcoxon rank-sum test are reported. Note that because age covaries with the total infectious virus shed (Fig. 3F), comparison of the total infectious virus shed after adjusting for age is shown in panel (B) (see Methods).
