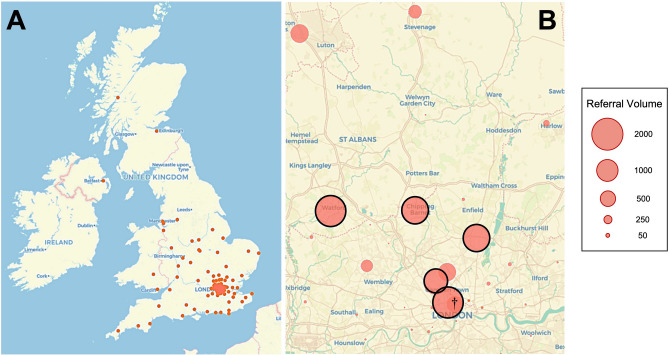
Figure 6.
Geographic referral visualization. (A) Map of referring sites (red dots) to the neurosurgical center from across the U.K. between March, 2020 and October 2021. (B) Northern Greater London referral catchment area with referring sites (red circles) size proportional to referral volume. The five highest volume main referring sites are highlighted with black borders. †Denotes the approximate location of the receiving neurosurgical center.

