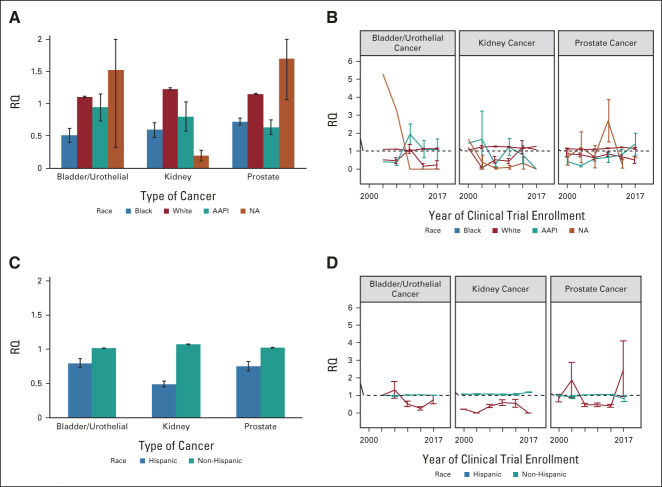
FIG 2.
Patient representation by race and ethnicity. (A) Aggregated representation by race across different urologic oncologic cancer types. Error bars represent the SE for each racial group. (B) Representation by race across the study period (2000-2017). (C) Aggregated representation by ethnicity across different urologic oncologic cancer types. Error bars represent SE for each ethnicity. (D) Representation by ethnicity across the study period (2000-2017). AAPI, Asian/Pacific Islander; NA, Alaska Native; RQ, representation quotient.

