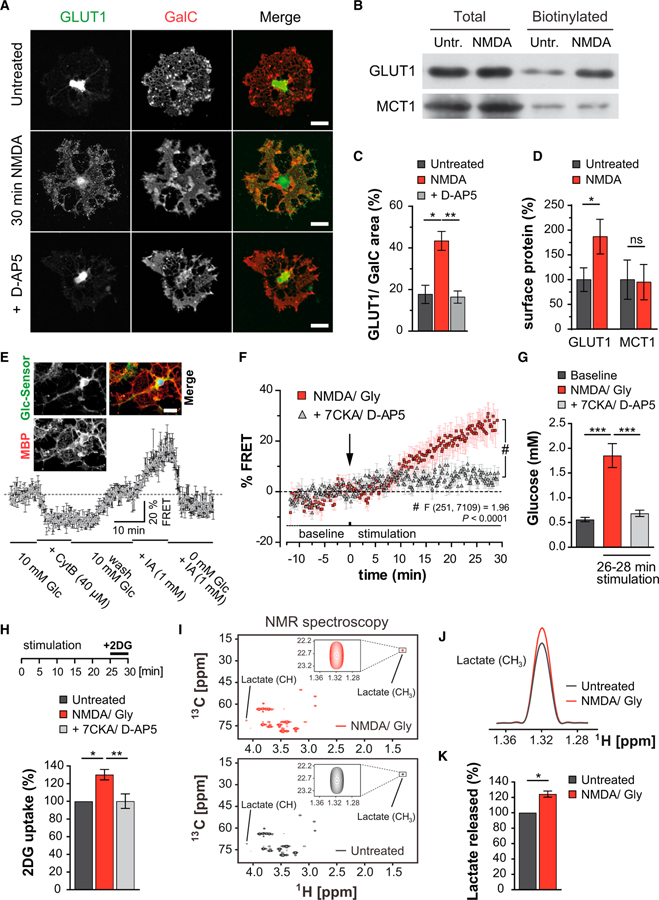
Figure 1. NMDA Stimulates GLUT1 Surface Expression and Glucose Uptake by Cultured Oligodendrocytes.
(A) Oligodendrocyte immunostained for GLUT1 and GalC. NMDA receptor stimulation mobilizes GLUT1 and increases its cell surface expression, which is blocked by D-AP5. Scale bar, 20 μm.
(B) GLUT1 and MCT1 immunoblots following cell surface biotinylation of immunopanned NMDA-treated oligodendrocytes and controls.
(C) Quantification of the experiments giving the ratio of GLUT1:GalC in a stained area of n = 3 experiments and 20–24 cells per condition (*p < 0.05, **p < 0.01 one-way ANOVA with Bonferroni’s multiple comparisons test).
(D) Quantification of the experiments in (B), normalizing biotinylated to total protein (p = 0.03, n = 3; paired t test). MCT1 surface expression is unchanged.
(E) FRET imaging of oligodendrocytes expressing a glucose sensor (Takanaga et al., 2008) (FLII12Pglu-700μΔ6). Intracellular glucose levels (normalized to baseline FRET signals, n = 4) drop with addition of cytochalasin B (CytB, glucose transporter blocker) or increase with iodoacetate (IA, glycolysis inhibitor). Note that intracellular glucose is rapidly phosphorylated and undetectable.
Inset: oligodendrocyte transfected with the glucose sensor and counterstained for MBP. Note that the sensor is mainly located in the soma and main processes. Scale bar, 20 μm.
(F) NMDA receptor stimulation (by applying 100 μM NMDA and glycine) increases FRET signals that can be blocked by the addition of 7CKA and D-AP5 (Finteraction(251, 7,109) = 1.96, p < 0.0001, two-way ANOVA).
(G) Quantification of calibrated FRET signals of NMDA-stimulated oligodendrocytes (26–28 min), compared to baseline and cells also receiving 7CKA and D-AP5 (***p < 0.001, one way ANOVA with Bonferroni’s multiple comparisons test).
(H) Immunopanned oligodendrocytes stimulated with NMDA/Gly (25 min) before switching to 2-deoxyglucose (2DG, 10 mM, 5 min). Increased 2DG uptake was blocked by 7CKA and D-AP5 (n = 5 experiments, *p < 0.05, **p < 0.01; paired t test).
(I) 13C, 1H-HSQC spectra at 700 MHz corresponding to proton resonance from the culture medium of immunopanned oligodendrocytes 30 min after exposure to NMDA/Gly (top) and controls (bottom). Boxed: lactate signals. Quantification by comparison of the peak volume of lactate methyl group to the internal standard DSS.
(J) Increased lactate following NMDA/Gly treatment, depicted by overlaying the 1D-1H slices of spectra in the lactate methyl signal range.
(K) Lactate release after NMDA receptor stimulation increased to 124% ± 4% (n = 4 paired NMR experiments, p = 0.023 paired t test).

