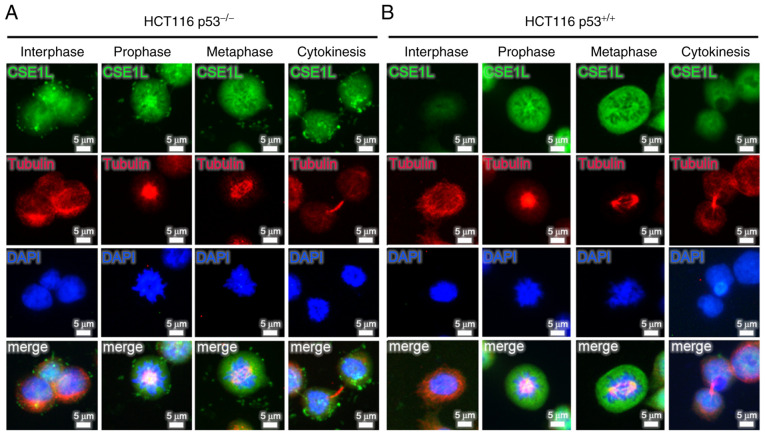
Figure 3.
Dynamic expression profiles of CSE1L throughout the mitotic phase of the cell cycle in HCT116 cells of different p53 statuses. Immunofluorescence microscopy was used to evaluate the localization of endogenously expressed CSE1L in separate (A) HCT116 p53+/+ cells and (B) HCT116 p53−/− cells at distinct phases of mitosis. CSE1L are presented in green. DAPI (nuclear DNA) is presented in blue. Tubulin is presented in red. Merge represents CSE1L + Tubulin + DAPI. Scale bar, 5 µm. HCT116 p53−/−, p53-null HCT116 cells; CSE1L, chromosome segregation 1-like protein.

