
Figure 3.
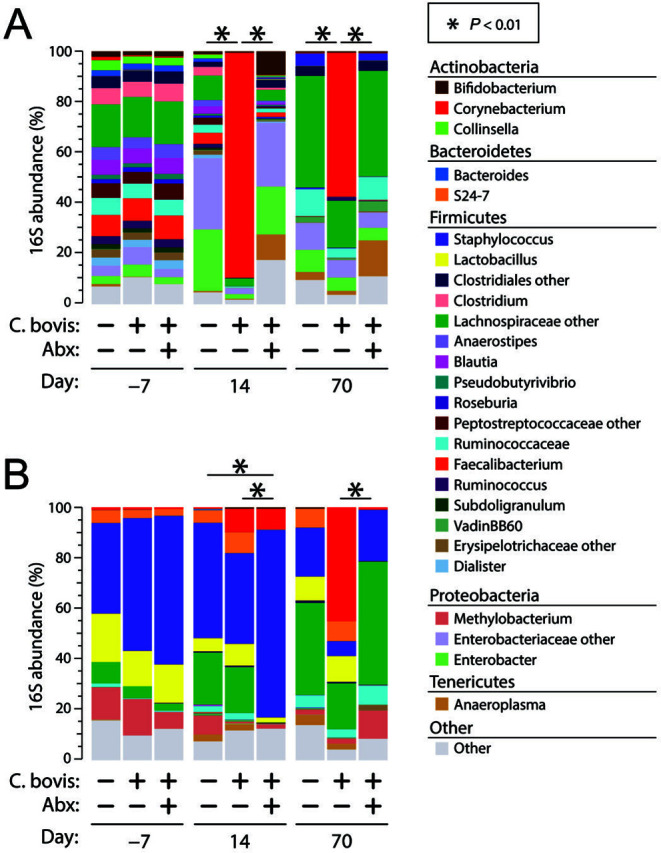
Bacterial profiles of skin microbiota. Bar charts summarize mean relative abundances (RA) of prominent genus-level bacterial taxa, stratified by mouse strain (panel A, nude; panel B, NSG), treatment group, and time point. Taxa with RA < 0.05% are collapsed into the Other category but were included in statistical tests. Significance was assessed through PERMANOVA tests at each time point. These tests were performed only among treatment arms within each time point (that is, comparisons were not made between time points). Each bar represents 5 mice for all groups, except NSG Cb−Abx− (n = 4).