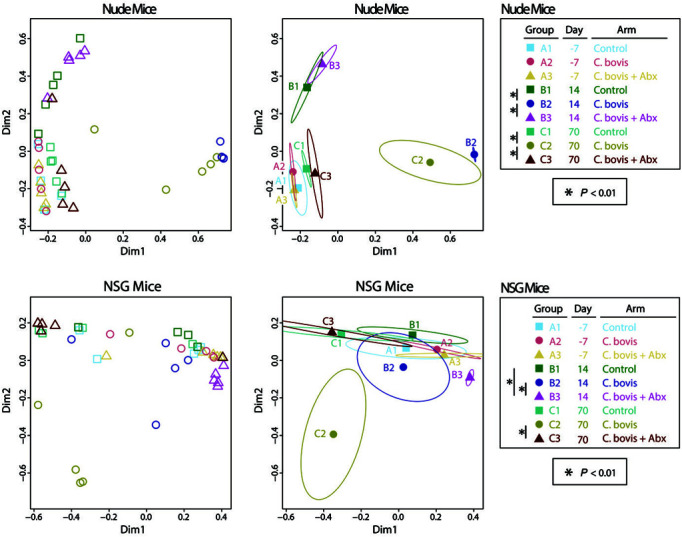
Figure 5.

Principal coordinates analysis of skin microbiota. Panels display plots of individual samples from either nude (upper panels) or NSG (lower panels) mice. Left panels show individual samples (open symbols), whereas right panels use ellipses to define a 1 SD spread in each group about the within-group centroids (filled symbols). Treatment groups and time points are indicated by different symbols and color-coding, as summarized in the key. Significance was assessed by between-group PERMANOVA tests and reflect the same statistical findings as in Figure 3.
