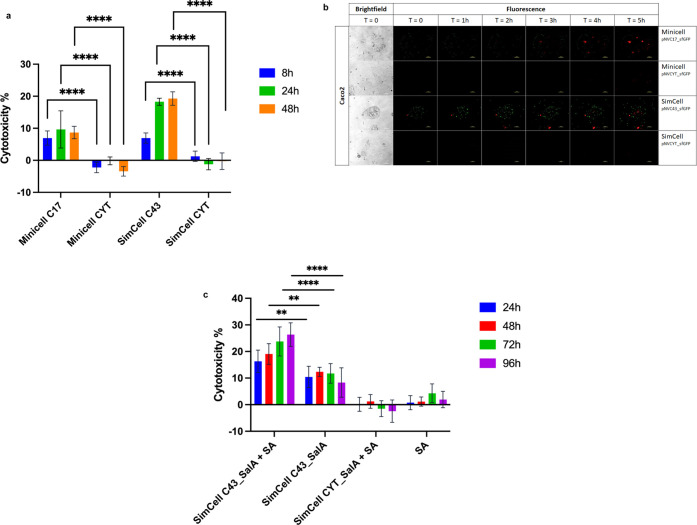
Figure 5.
Induction of targeted cancer cell death via SimCell and mini-SimCell in vitro. (a) Cytotoxicity of targeted mini-SimCell C17 and SimCell C43 (representing pNVC17_sfGFP and pNVC43_sfGFP, respectively) toward Caco2 compared to their nonspecific counterparts CYT (representing pNVCYT_sfGFP). Caco2 was first incubated with mini-SimCells and SimCells for 2 h, followed by washing thrice with fresh media prior to further incubation at 37 °C with 5% CO2. LDH assay was used to measure cytotoxicity at T = 8, 24, and 48 h. Error bars represent the standard deviation from eight biological repeats. (b) Time-lapse images of Caco2 at time point 0, 1, 2, 3, 4, and 5 h after 2 h of incubation with mini-SimCell (pNVC17_sfGFP and pNVCYT_sfGFP) and SimCell (pNVC43_sfGFP and pNVCYT_sfGFP). All cultures were washed thrice and added with fresh media supplemented with ethidium homodimer prior to imaging. The remaining SimCells and mini-SimCells are in green and the nuclei of Caco2 with compromised membrane were stained by Ethidium homodimer (red). Scale bar is 100 μm. The full 5-h time-lapse video can be found in Supporting Information Movie S1. (c) Cytotoxicity of targeted SimCell C43_SalA (representing pNVC43_SalA_sfGFP) toward Caco2 with and without the addition of salicylic acid (SA) in comparison to preincubation with nonspecific SimCell CYT_SalA (representing pNVCYT_SalA_sfGFP). Caco2 was first incubated with SimCells for 2 h, followed by washing thrice with fresh media supplemented with 500 μM of SA prior to further incubation at 37 °C with 5% CO2. LDH assay was used to measure the cytotoxicity at T = 24, 48, 72, and 96 h. Error bars represent the standard deviation from eight biological repeats. Statistical test performed is 2-way ANOVA, **p ≤ 0.01; and ****p ≤ 0.0001.

