Figure 4.

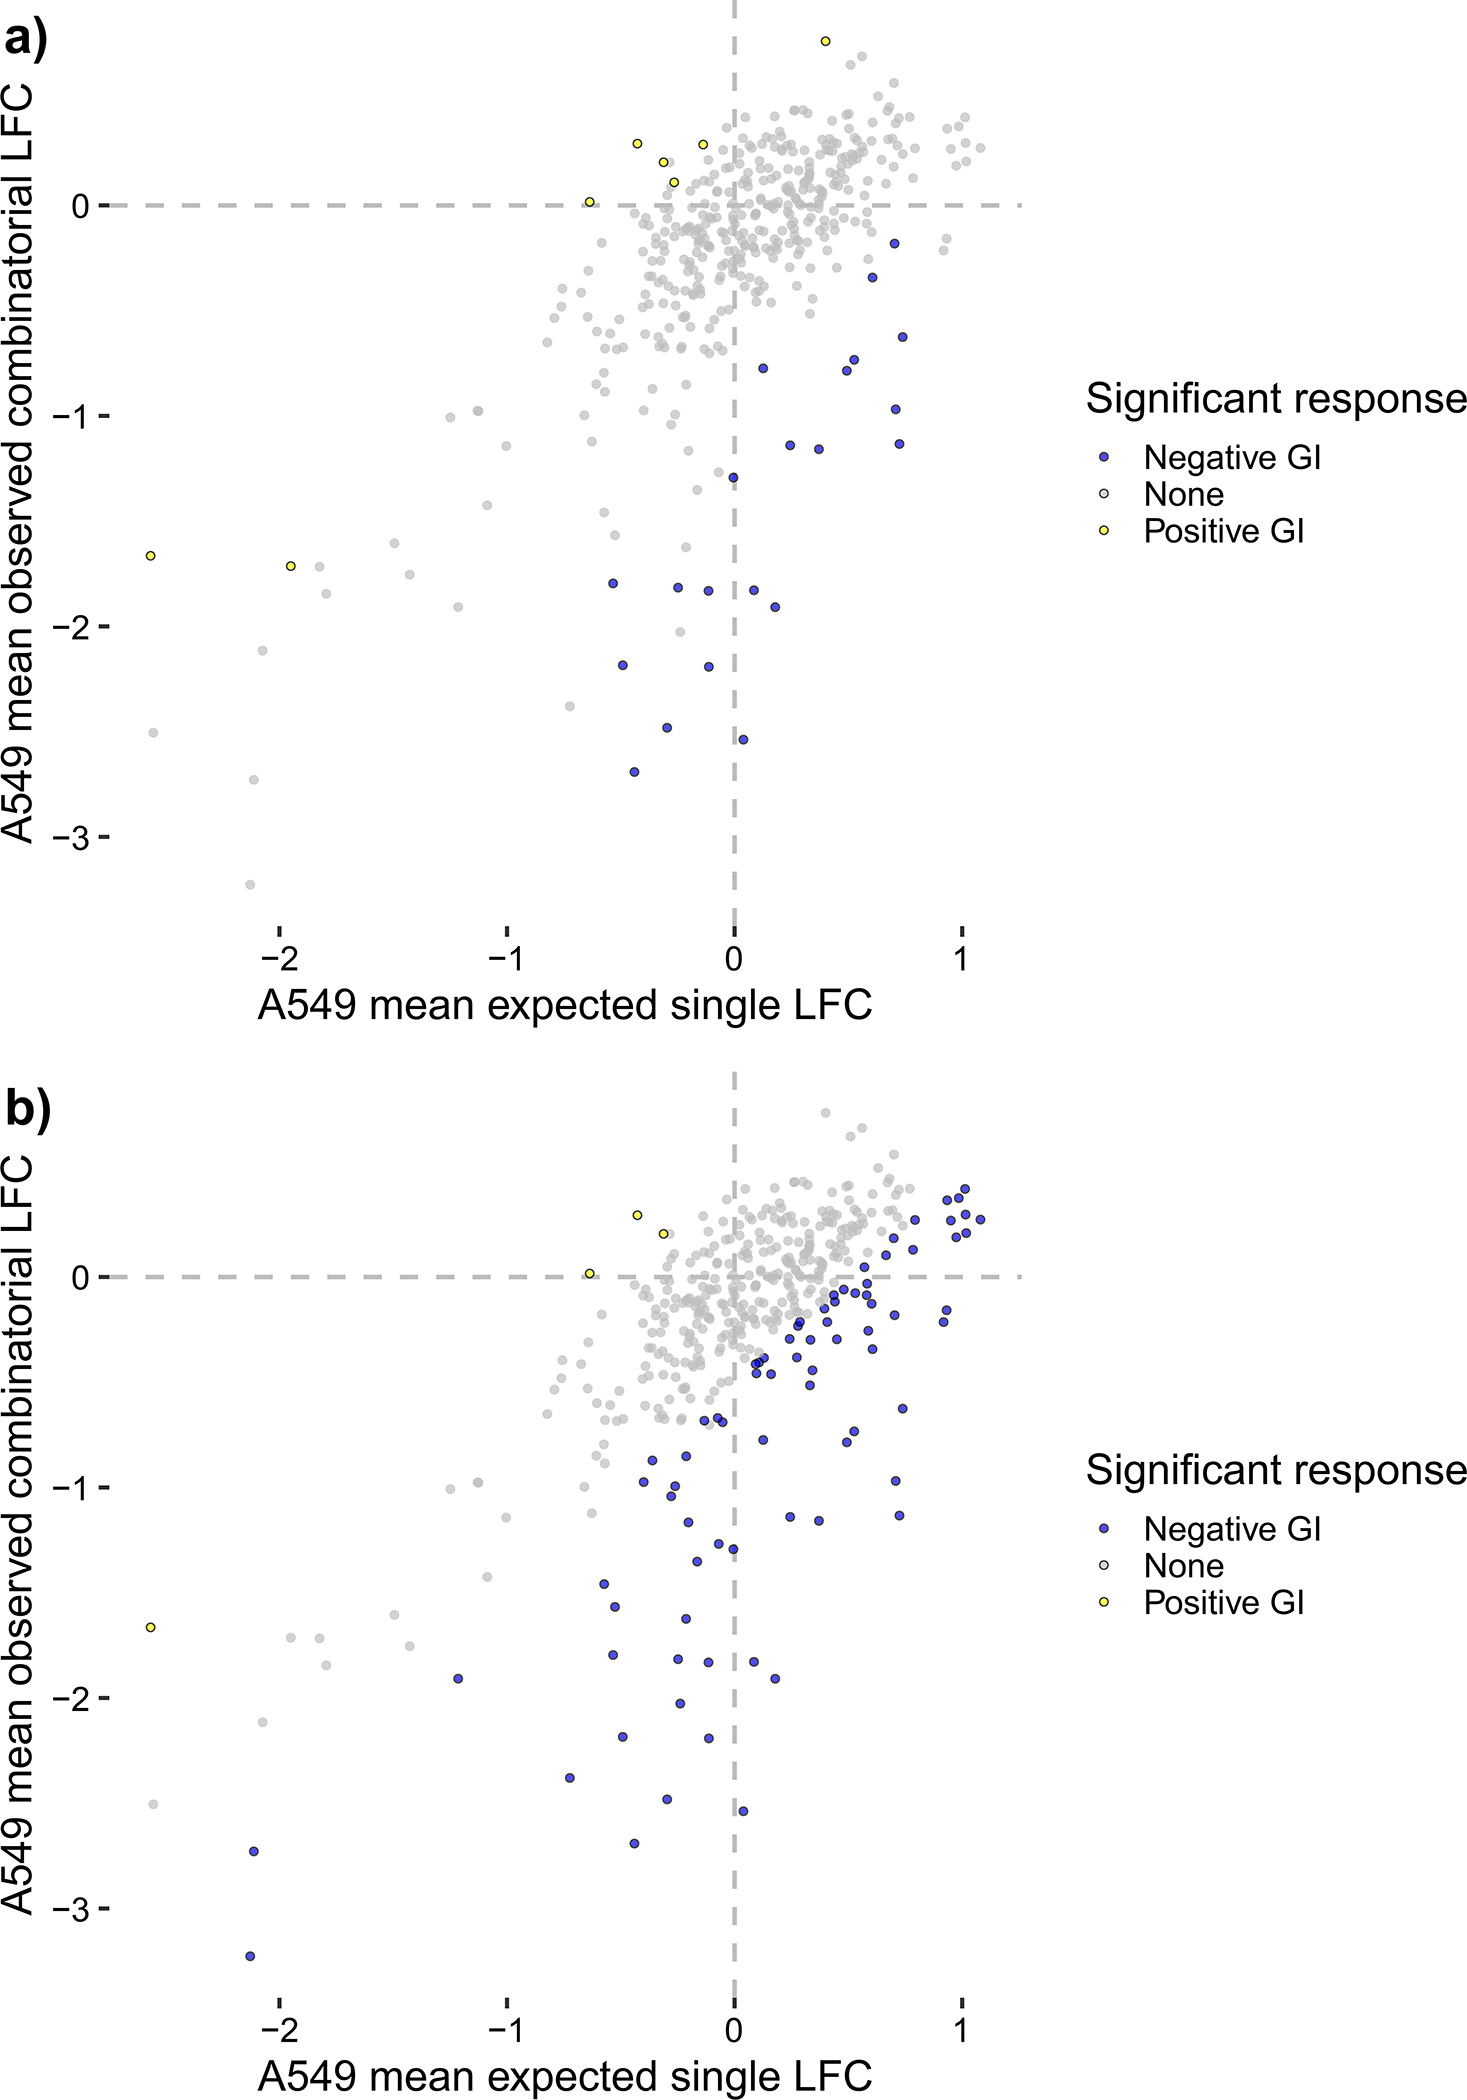
Summary plots of mean LFC, colored by significant effects, for all n = 403 gene pairs with combinatorial- and single-targeting guides for the Dede et al. A549 screen analyzed in Procedure 3. Gene-level GIs are shown as colored points that significantly deviate from the computed null model. Blue points are negative GIs with mean residual effects < −0.5 and Benjamini and Yekutieli FDRs < 0.2, while yellow points are positive GIs with mean residual effects > 0.5 and Benjamini and Yekutieli FDRs < 0.2. (a) shows scores with loess-normalization enabled for 8 positive GIs and 21 negative GIs, and (b) shows scores with loess-normalization disabled for 4 positive GIs and 78 negative GIs. For this dataset, we conclude that loess-normalization is not recommended due to potential false positives and negatives introduced in the bottom two quadrants of (a).
