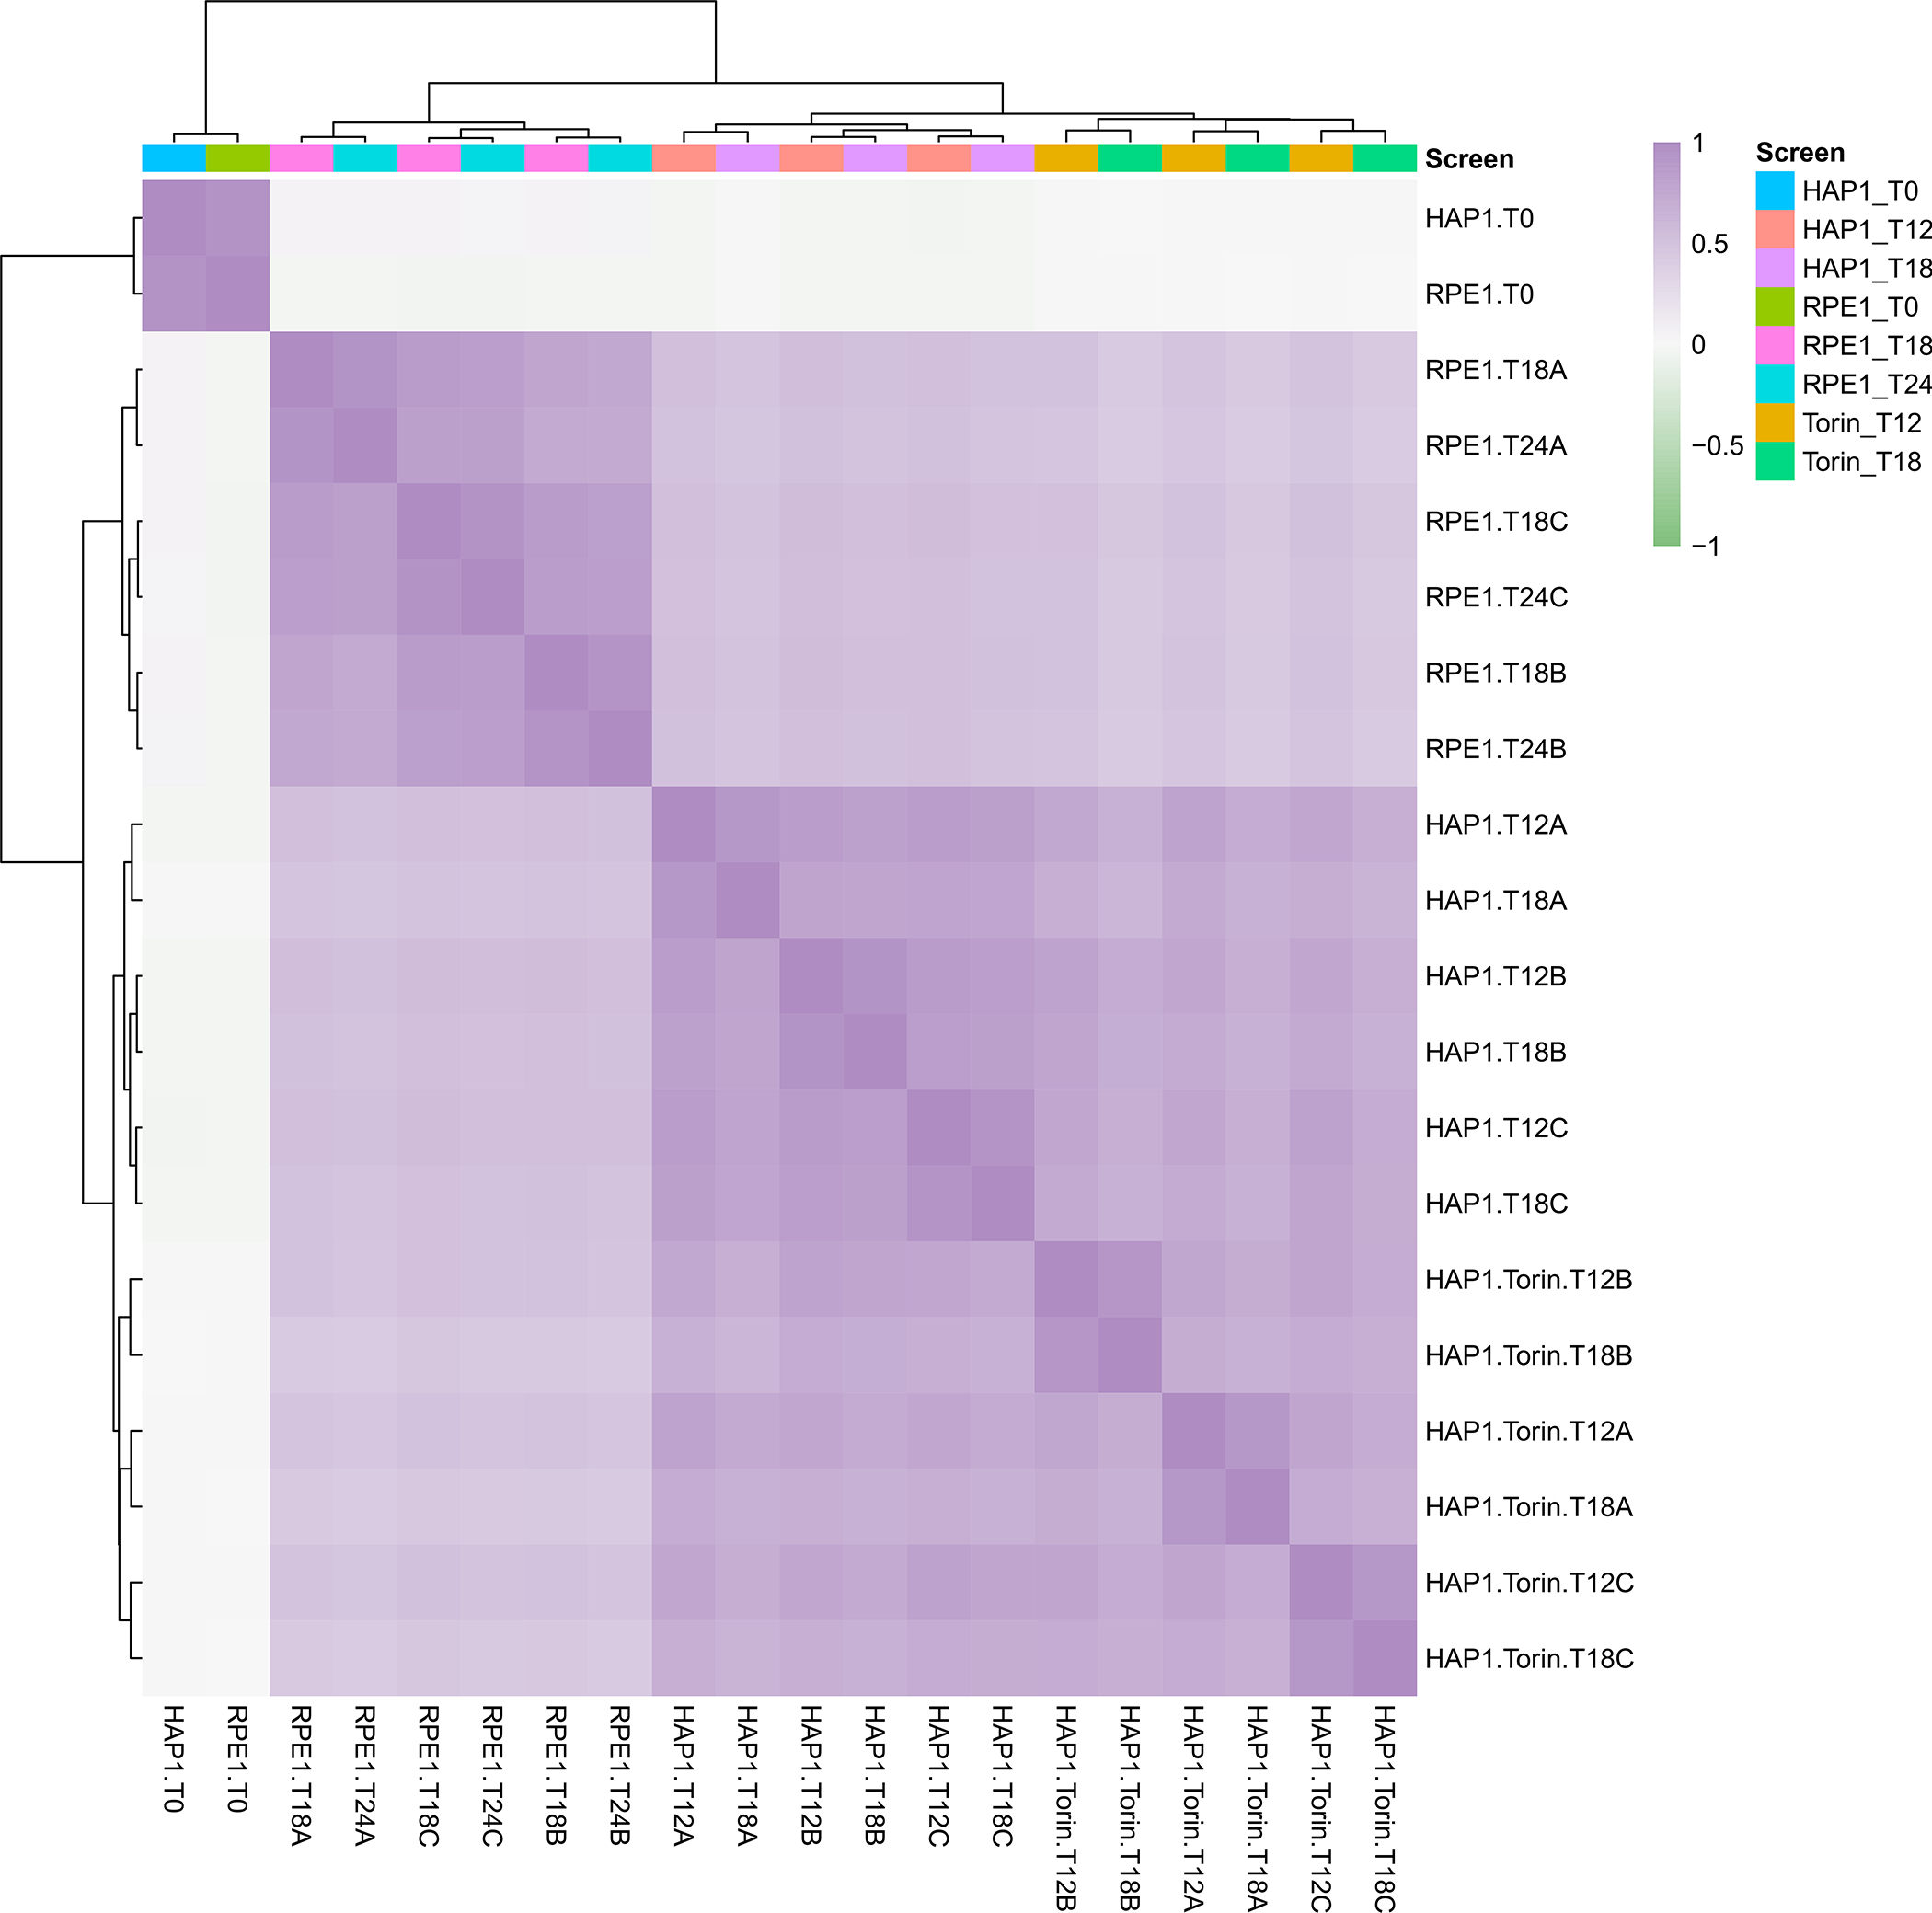
Figure 6.

Heatmap of Pearson correlations between LFCs for all technical replicates in the example CHyMErA dataset (n = 20), output in Procedure 2 Step 8. Well-correlated screens cluster together depending on the main sources of variation in the dataset. Here, RPE1 screens cluster separately from the HAP1 screens, which are further clustered into WT HAP1 screens and HAP1 + Torin1 screens.
