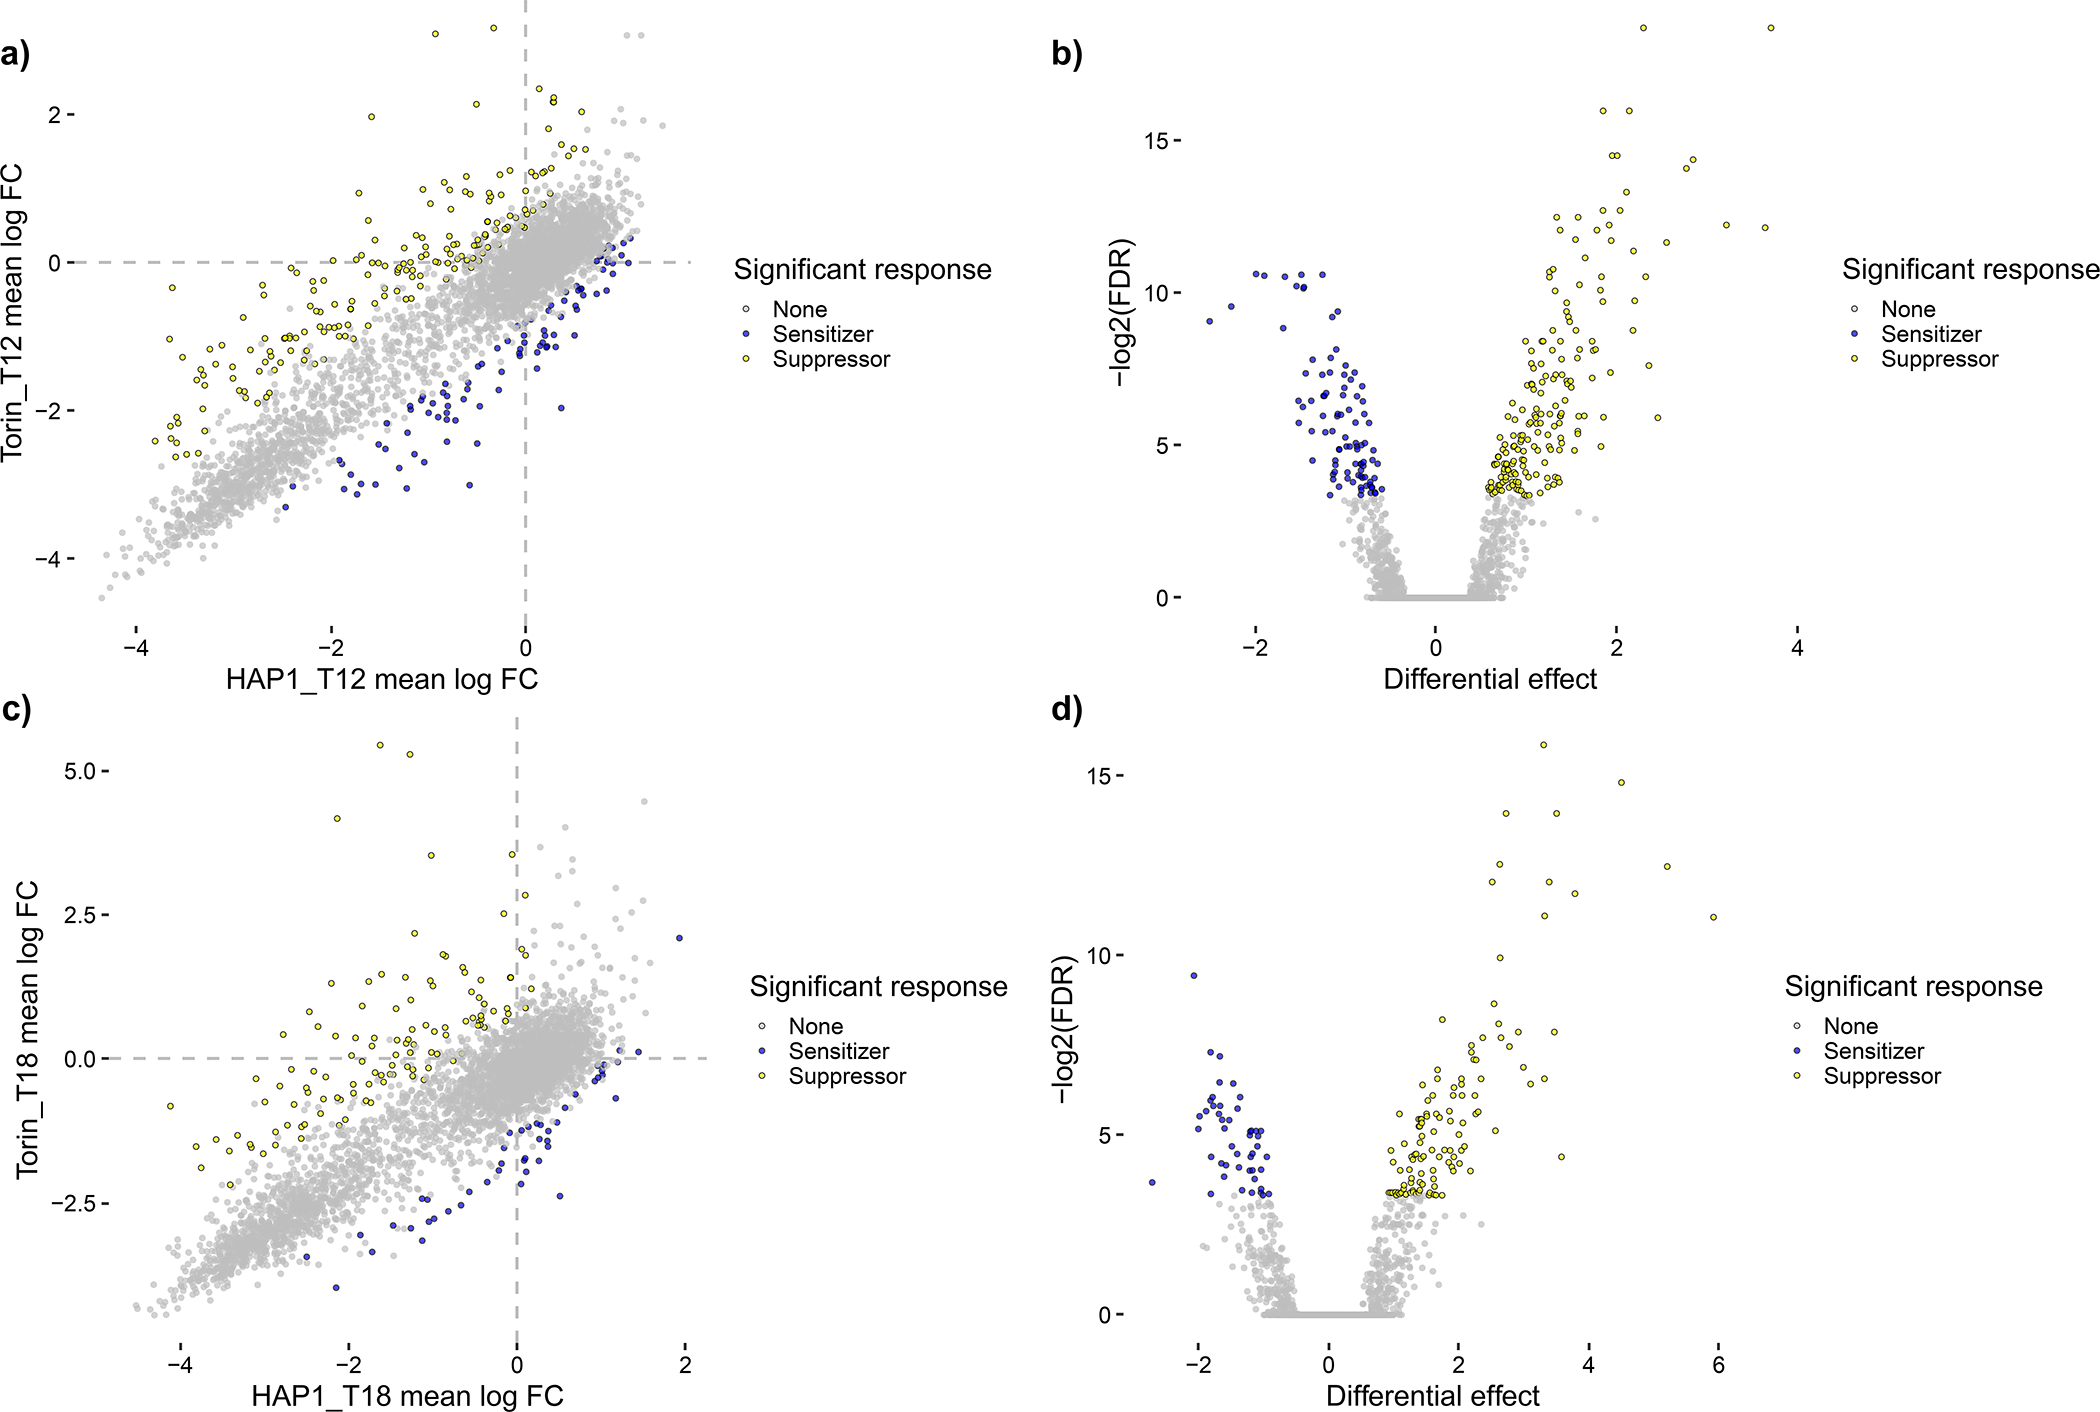
Figure 7.

Summary plots of mean LFC, colored by significant effects, for WT HAP1 and HAP1 + Torin1 screening data for all n = 3,870 gene pairs with dual-targeting guides analyzed in Procedure 2, Steps 11–14. Gene-level drug-gene interactions, where sensitizer interactions indicate that the gene’s knockout confers increased sensitivity to Torin-1 and suppressor interactions indicate that the knockout bypasses potentially deleterious effects of Torin-1 on cell fitness, are shown as colored points that significantly deviate from the computed null model. Blue points are sensitizing interactions with mean residual effects < −0.5 and Benjamini and Yekutieli FDRs < 0.1, while yellow points are suppressor interactions with mean residual effects > 0.5 and Benjamini and Yekutieli FDRs < 0.1. (a) and (b) show scores for T12 data in a scatter plot and a volcano plot, respectively, for 182 suppressor interactions and 93 sensitizer interactions. (c) and (d) show scores for T18 data in a scatter plot and a volcano plot, respectively, for 114 suppressor interactions and 47 sensitizer interactions. These plots allow users to contextualize effect size, effect strength, and statistical significance for both WT HAP1 data at T12 and WT RPE1 data at T24.
