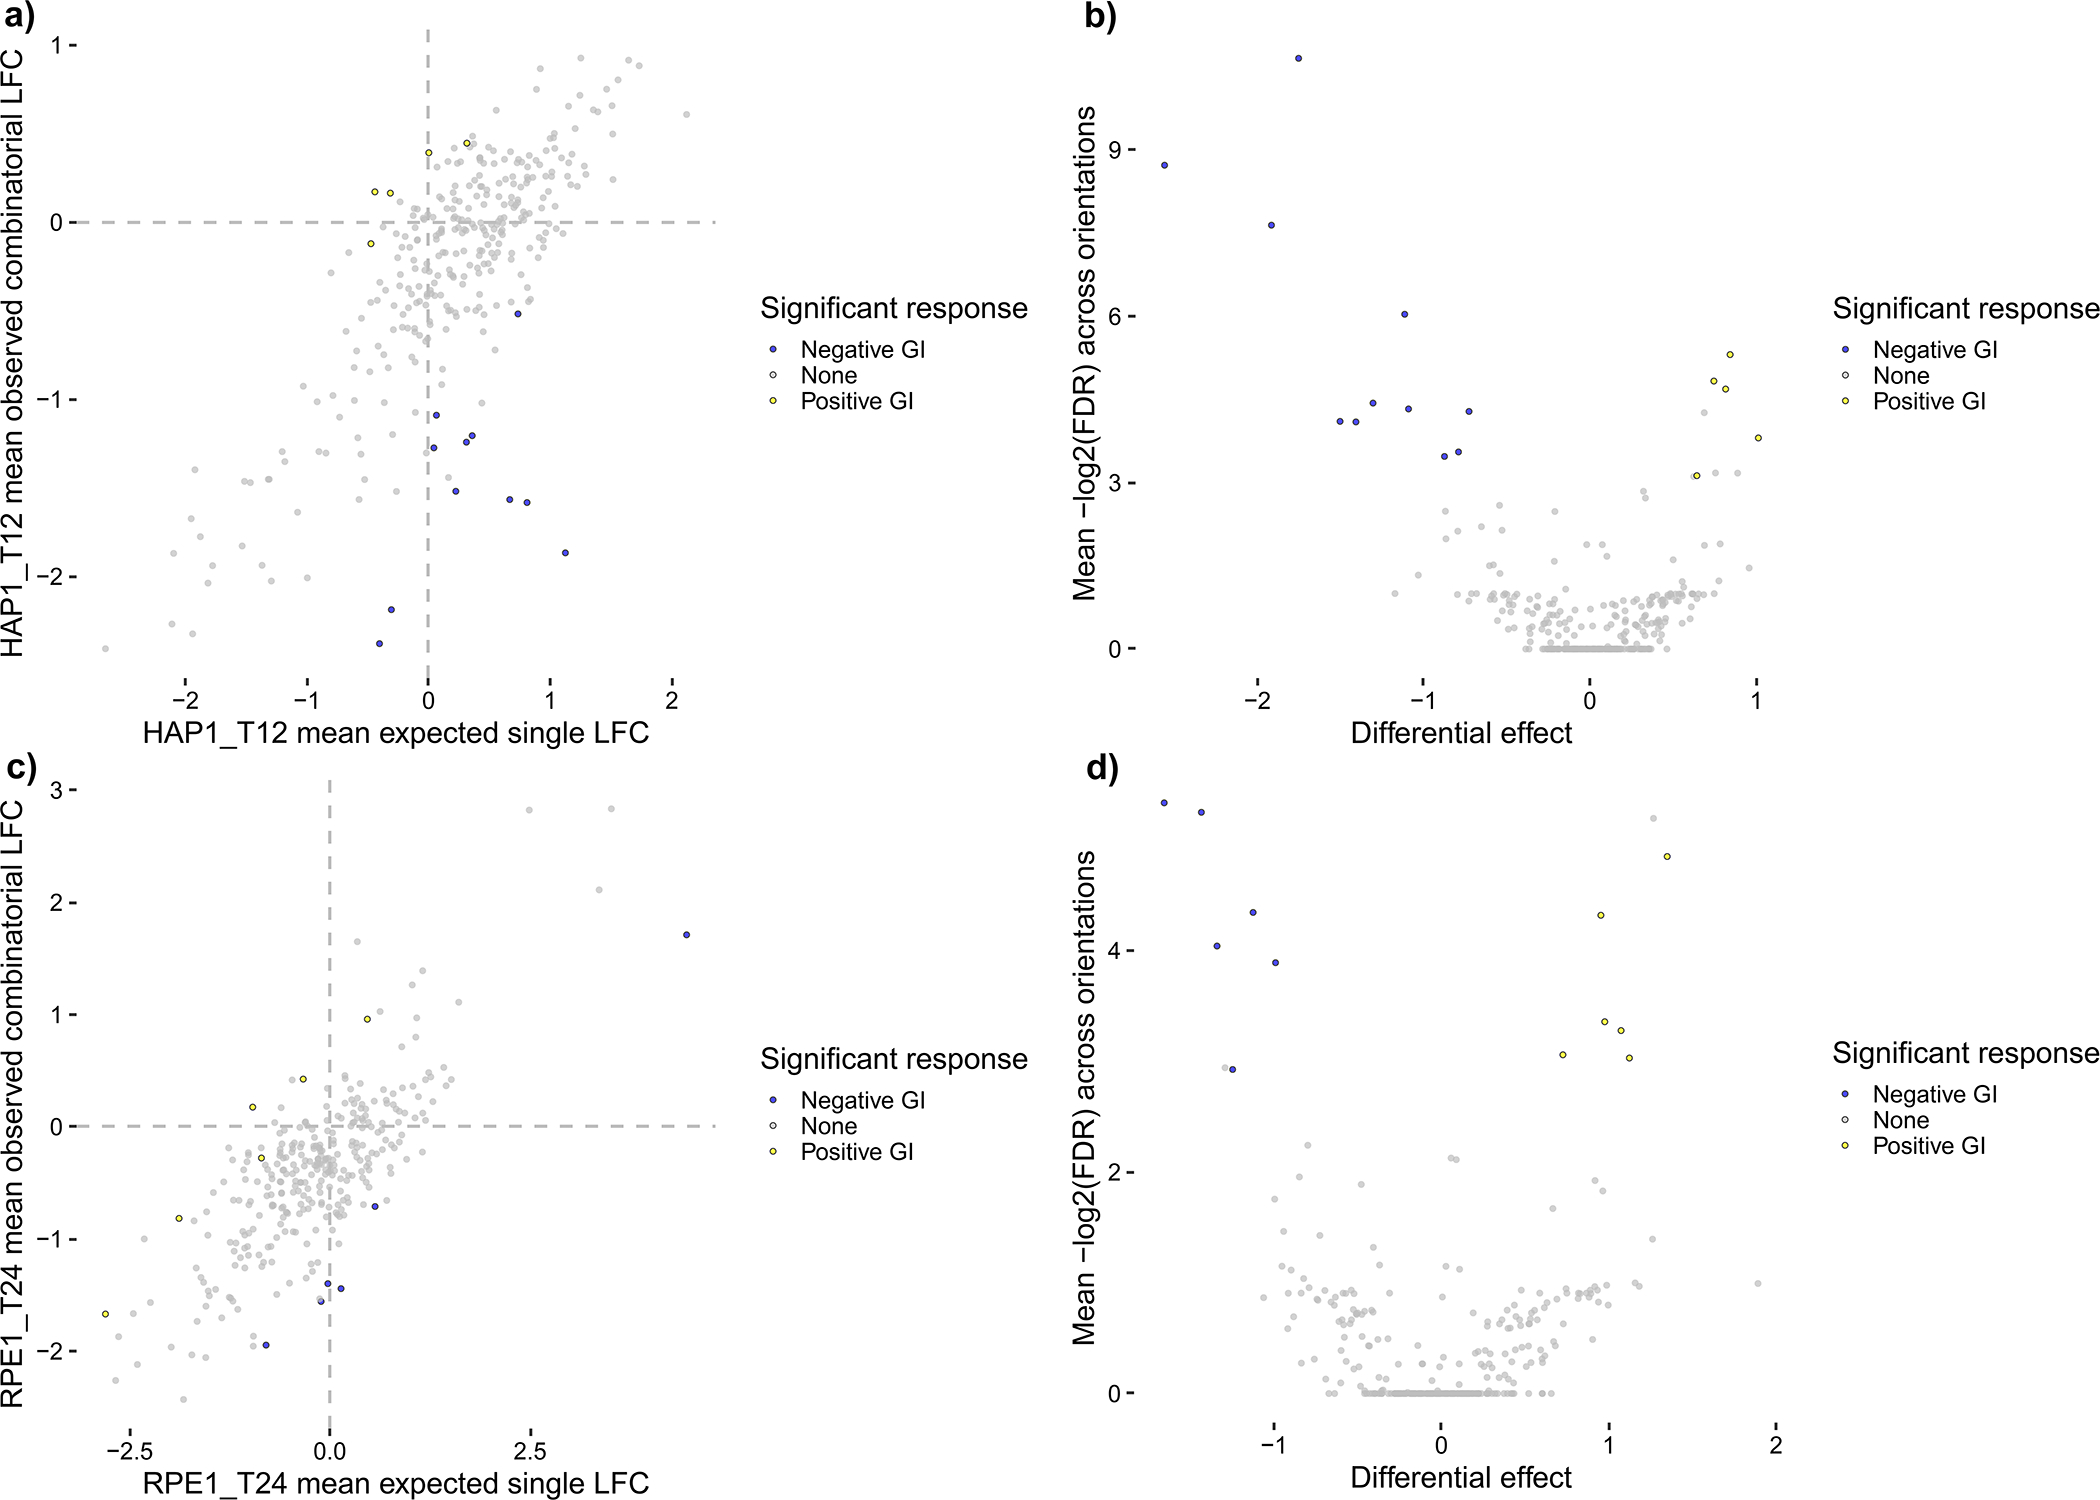
Figure 9.

Summary plots of mean LFC, colored by significant effects, for all n = 313 CHyMErA gene pairs with combinatorial- and single-targeting guides analyzed in Procedure 2, Steps 15–17. Gene-level GIs are shown as colored points that significantly deviate from the computed null model. Blue points are negative GIs with mean residual effects < −0.5 and Benjamini and Yekutieli FDRs < 0.2, while yellow points are positive GIs with mean residual effects > 0.5 and Benjamini and Yekutieli FDRs < 0.2. (a) and (b) show scores for WT HAP1 data at T12 in a scatter plot and a volcano plot, respectively, for 5 positive GIs and 11 negative GIs. (c) and (d) show scores for WT RPE1 data at T24 in a scatter plot and a volcano plot, respectively, for 6 positive GIs and 6 negative GIs. These plots allow users to contextualize effect size, effect strength, and statistical significance for both WT HAP1 data at T12 and WT RPE1 data at T24.
