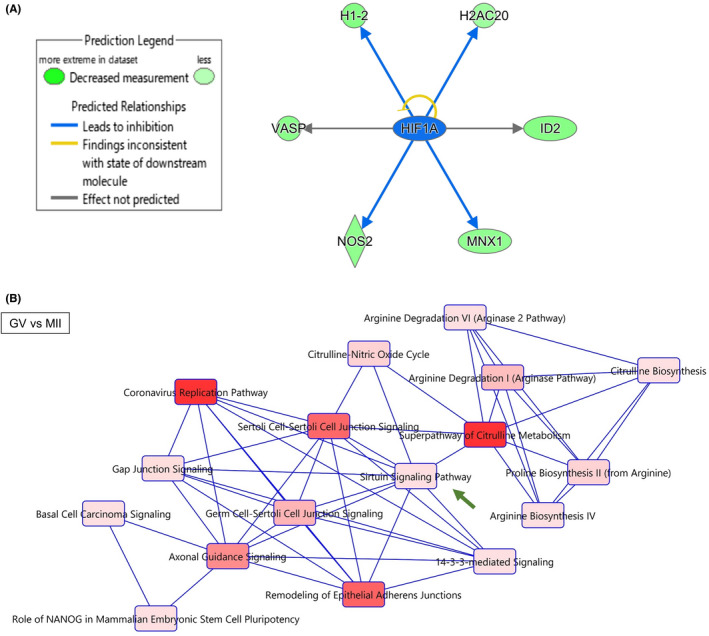
FIGURE 2.

Gene regulatory networks that are associated with dynamic transcriptome changes during human oocyte maturation. (A) Downstream targets of HIF1A were found in the DEG list by Ingenuity Pathway Analysis (IPA). Blue arrows mean “Leads to inhibition,” and black arrows mean “Effect not predicted.” Molecules colored green are downregulated in MII samples. (B) Canonical pathways predicted by IPA using the DEG list of GV versus MII. Significant terms are indicated in red colors: the darker the color, the more significant the term is (p < 0.05, Fisher's exact test). Closely related terms are connected to each other. A green arrow indicates Sirtuin signaling pathway as explained in the relevant text
