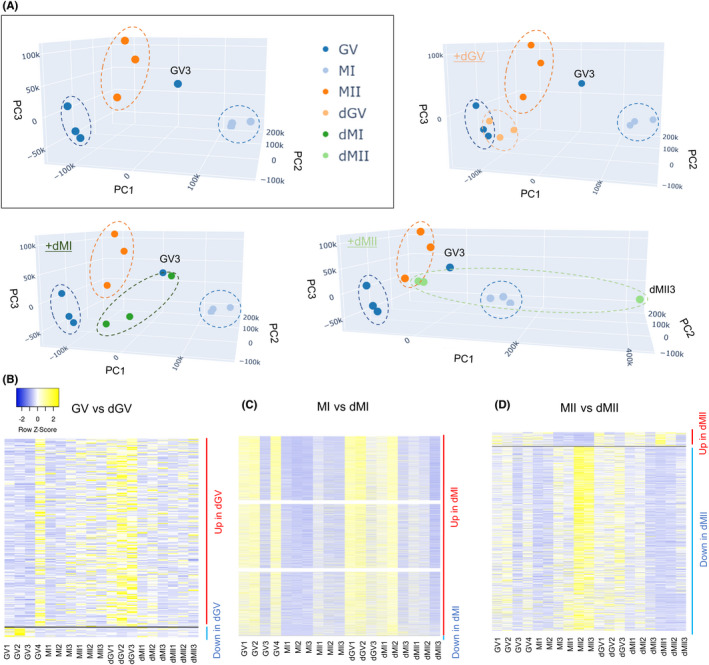
FIGURE 3.

Human oocytes that are delayed in their maturation show different transcriptomes from those matured in an earlier timing. (A) PCA of the gene expression profiles (3–4 biological replicates per each category). The top left image in the rectangle includes samples collected on the day for oocyte retrieval (Figure 1A) (GV, MI, and MII). Nine delayed oocytes were collected from seven patients. Blue dots: GV samples, light blue dots: MI samples, dark orange dots: MII samples, light orange dots: dGV samples, dark green dots: dMI samples, and light green dots: dMII samples. (B–D) Heatmaps depicting the gene expression levels of DEGs identified in the indicated comparisons. (B) shows DEGs in dGV (GV vs. dGV), (C) shows those in dMI (MI vs. dMI), and (D) shows those in dMII (MII vs dMII) samples. Color key with z‐score is shown
