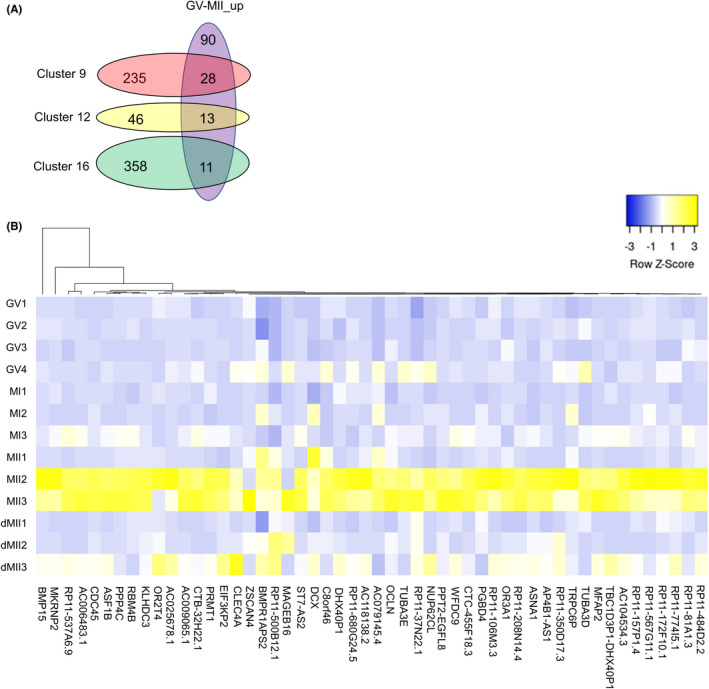
FIGURE 6.

Marker genes for in vitro matured human MII oocytes and potential biomarkers for MII oocytes with high quality. (A) Venn diagrams showing the numbers of total and overlapping genes among genes that belong to clusters 9, 12, and 16, and upregulated genes in the GV versus MII comparison. (B) A heatmap depicting the gene expression levels of candidate genes for human MII oocytes with high quality. Gene symbols are listed. Color key with z‐score is shown
