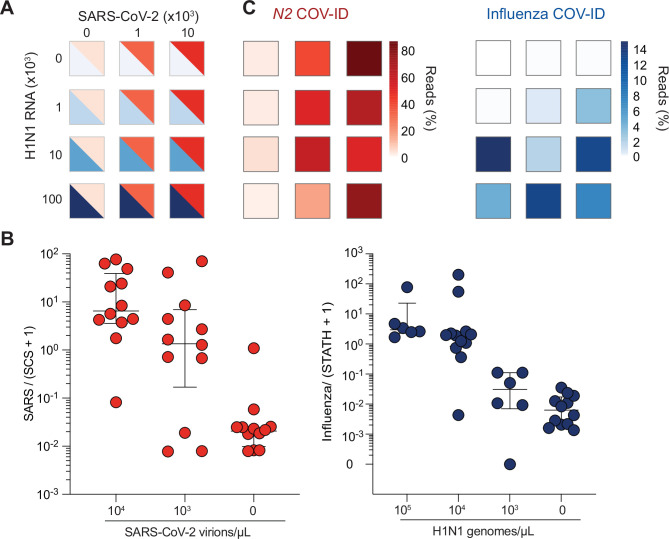
Figure 3. COV-ID multiplex detection of SARS-COV-2 and Influenza A.
(A) TCEP/EDTA treated saliva was spiked with indicated amounts of BEI heat-inactivated SARS-CoV-2 or H1N1 influenza A RNA to the indicated concentration of virions/genomes per µL. One microliter of saliva was used for COV-ID reactions. (B) COV-ID was performed in two independent experiments on saliva samples from the matrix shown in (A) in the presence of 20 femtograms N2 synthetic calibration standard (SCS) using N2, influenza (MacKay et al., 2020) and STATH COV-ID primers. N2/(SCS +1) and influenza/(STATH +1) read ratios are displayed with bars showing median ± interquartile range. Circles represent individual biological replicates. Samples were considered positive for a given sequence if the associated read ratio was greater than 2x the maximum value in the control saliva samples. (C) Heatmaps of SARS-CoV-2 (left) or H1N1 (right) COV-ID signal in multiplex reaction. Individual data points are from (B). The heatmap color represents the mean of the percentage of viral reads in each sample.

