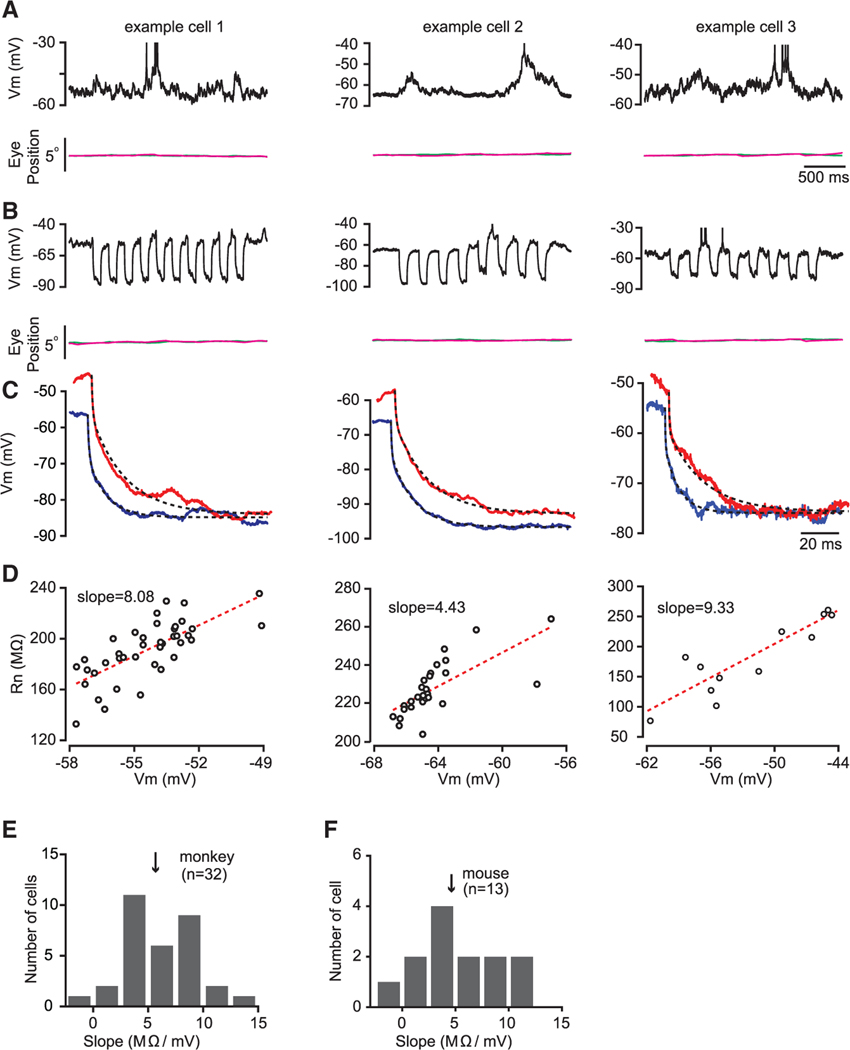
Figure 1. Input Resistance Changes with Membrane Potential during Spontaneous Activity.
(A) Membrane potential fluctuation for three example cells in V1 of behaving macaque in a fixation task. Top: membrane potential in single trials is shown. Bottom: horizontal (magenta) and vertical (green) eye traces are shown. The short horizontal bar indicates timescale.
(B) Input resistance measurements for these three example cells were obtained by injecting negative current pulses. The duration of these current pulses was 100 ms with a 150-ms interval (top). Bottom: eye traces are shown.
(C) Estimation of input resistance by fitting changes in membrane potential with a sum of two exponentials functions (see STAR Methods for details) for the three example cells. Dashed lines represent double exponentials used to fit the data.
(D) A positive relationship between input resistance (Rn) and membrane potential (Vm) for the three example cells. Each dot represents a current injection pulse. Only injection pulses that fell within the 3-mV inclusion criteria (see STAR Methods) were included in the analysis. Red dashed lines represent linear regressions.
(E) Histograms of the Rn-Vm slopes for a population of cells from two behaving macaques. The arrow indicates the median slope.
(F) Histograms of the Rn-Vm slopes for a population of V1 cells from anesthetized mice.

