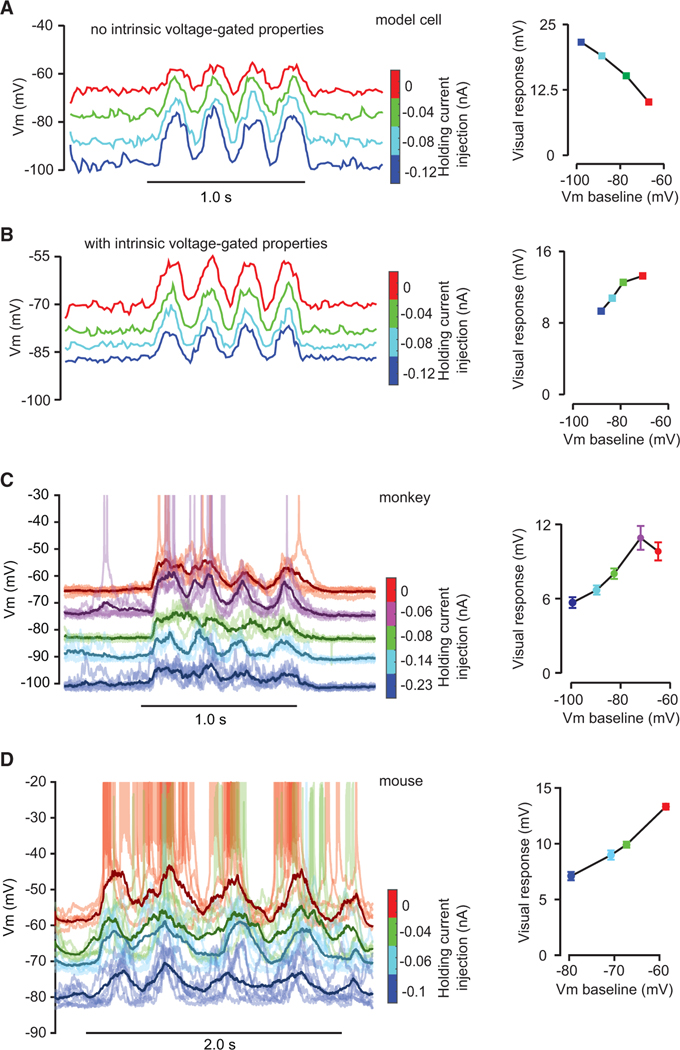
Figure 4. Visual Responses at Different Vm Baseline Levels during Constant Current Injection.
(A and B) Simulated responses for a model neuron without (A) and with (B) intrinsic voltage-gated properties at different Vm baseline levels. The horizontal bar indicates stimulus onset and duration (left), which includes four cycles of a drifting sine-wave grating in a trial (4 Hz). The color bars indicate constant current injection levels (middle). Responses (right) are mean values of the peak across trials and cycles of visual stimulus.
(C and D) Measured visual responses of example V1 cells from behaving macaque (C) and anesthetized mouse (D). Symbols are similar to (A) and (B). Error bars indicate ± SEM.

