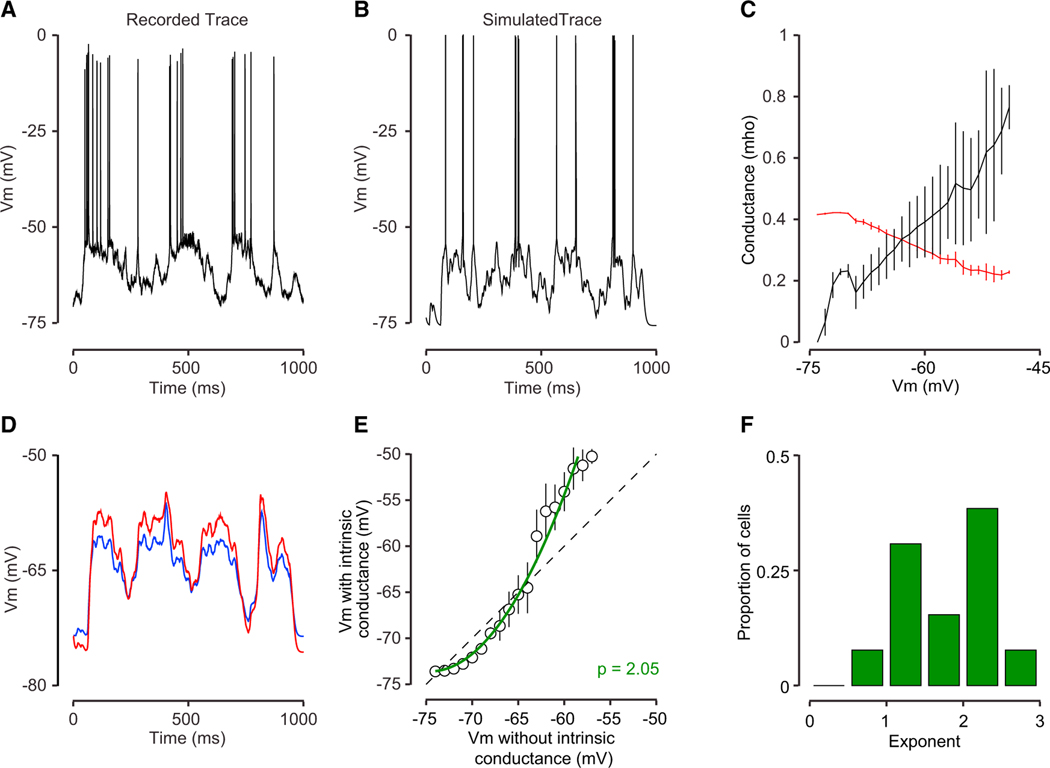
Figure 6. Modeling the Responses of Primate V1 Neurons with Voltage-Gated Conductances.
(A) A single-trial membrane potential response to a grating presented at the preferred orientation from macaque monkey V1.
(B) A model of that trial’s response.
(C) The relationship between the model membrane potential and conductances in the simulations. The conductance forthe intrinsic channel (red) declined with depolarization although synaptic conductance increased with depolarization (black).
(D) Membrane potential traces for a model with the intrinsic channel (red) and without the intrinsic conductance (blue) for the same synaptic input.
(E) Average Vm for the model with the voltage-gated conductance is plotted relative to the Vm for the model without the voltage-gated conductance for the example cell. The green line indicates a power law fit between Vm in the two models.
(F) The distribution of the fit exponent across neurons in our population of primate neurons.

