
FIGURE 2.
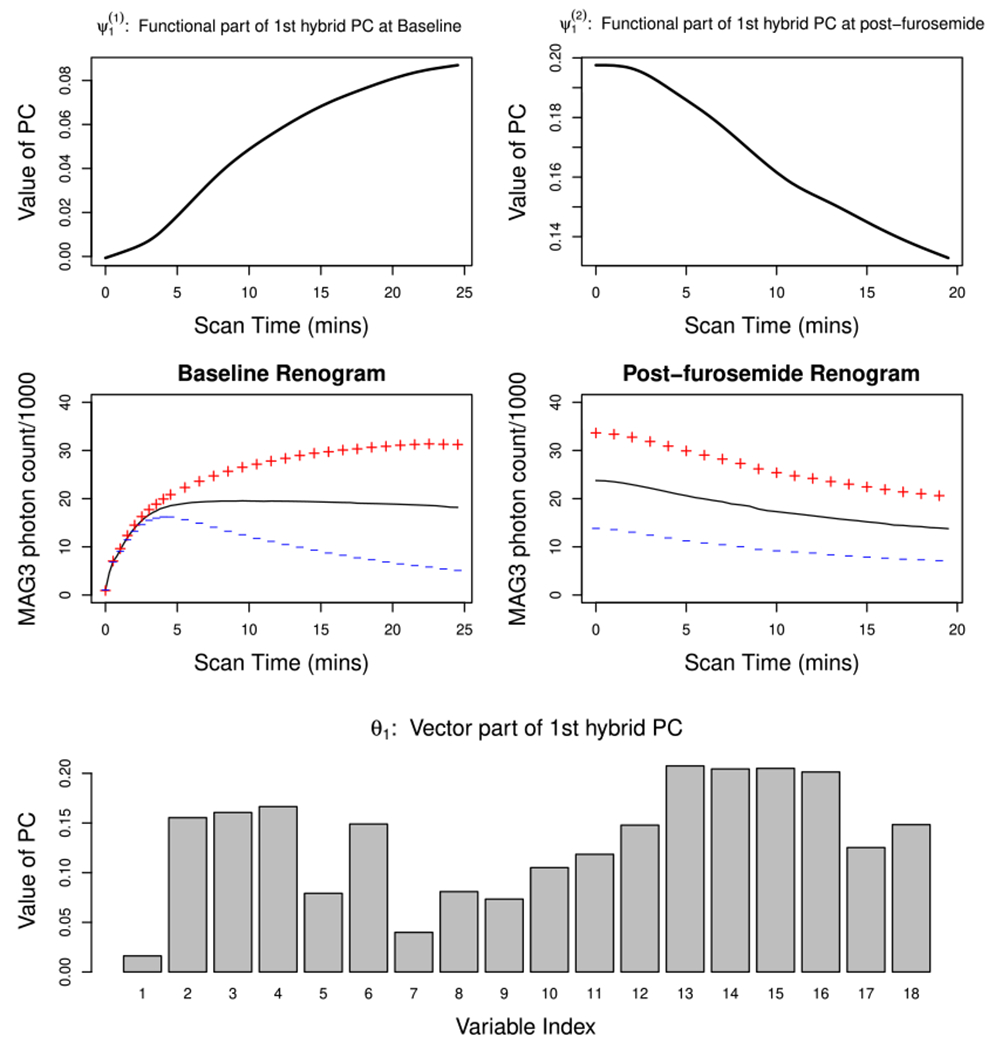
Estimated 1st hybrid PC of the Emory renal study data. The top panel represents the functional part of the estimated 1st hybrid PC: (left; baseline) and (right; post-furosemide. The middle panel plots the mean functions (solid line) and the effects of adding (+) and subtracting (−) a suitable multiple of (left) and (right). The bottom panel is the barplot for the vector part of the estimated 1st hybrid PC θ1. [Colour figure can be viewed at wileyonlinelibrary.com]