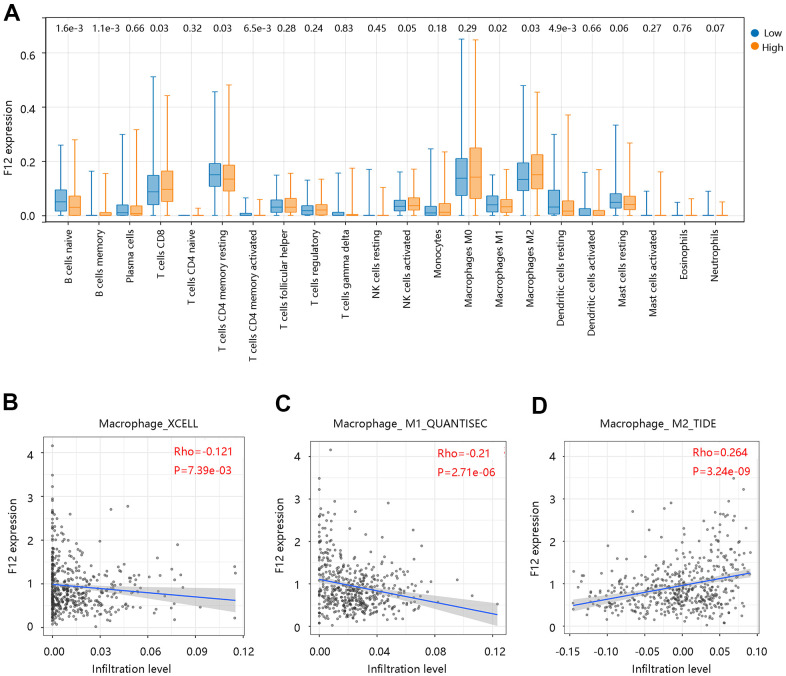
Figure 10.
Correlation between F12 and immune cell infiltration in papillary thyroid cancer by CIBERSORT. (A) Immune cell infiltration level in the low- and high- F12 expression group. (B) Association of F12 expression with macrophage infiltration levels. (C) Association of F12 expression with M1 macrophage infiltration level. (D) Association of F12 expression with M2 macrophage infiltration level.

