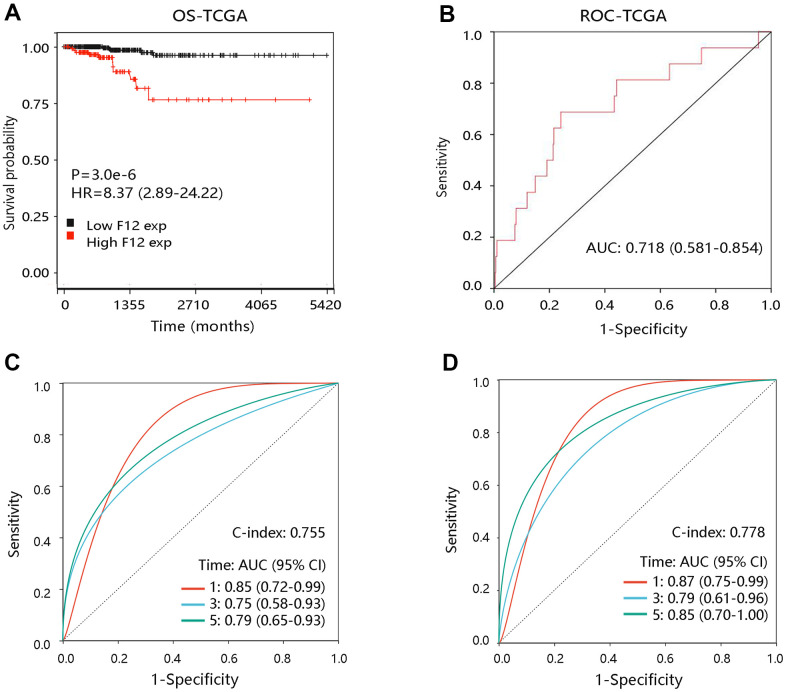
Figure 5.
The prognostic value of F12 in PTC. (A) The association of F12 expression with OS of PTC patients. (B) The ROC curve of F12 expression for predicting the survival status. (C) Time-dependent ROC analysis in all PTC patients. (D) Time-dependent ROC analysis in PTC patients at stage III-IV. PTC, papillary thyroid cancer; ROC, receiver operating characteristic; OS, overall survival; HR, hazard ratio; AUC, area under the curve.

