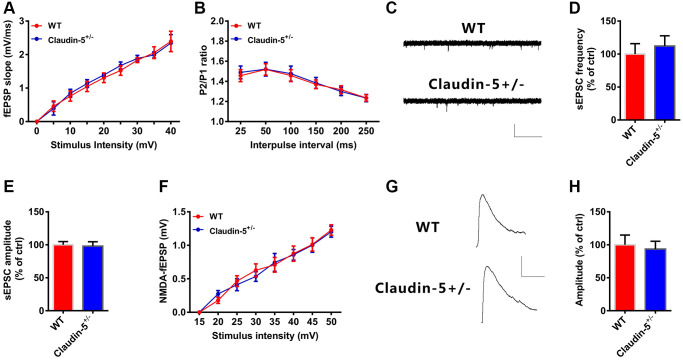
Figure 5.
Effects of knockout of claudin-5 on glutamatergic transmission in hippocampal slices. (A) I-O curves in claudin-5+/− mice and their control littermates (n = 6 per group; repeated measures two-way ANOVA). (B) PPF in claudin-5+/− mice and their control littermates (n = 6 per group; repeated measures two-way ANOVA). (C–E) sEPSCs recording in claudin-5+/− mice and their control littermates. Average sEPSC frequency (Hz) in (D) and amplitude in (E) were obtained (n = 9 per group; two-tailed Student’s t-test). Scale bars: 20 pA, 2 s. (F) NMDAR fEPSPs slopes in claudin-5+/− mice and their control littermates (n = 6 slices/group; repeated measures two-way ANOVA). The fEPSPs were recorded in the presence of 20 μM CNQX and 0 nM Mg2+. (G, H) NMDA currents recording in claudin-5+/− mice and their control littermates (n = 9 per group; two-tailed Student’s t-test). Scale bars: 50 pA, 100 ms. Data show mean ± s.e.m.

