. 2018 Aug 22;8(52):29698–29713. doi: 10.1039/c8ra05845h

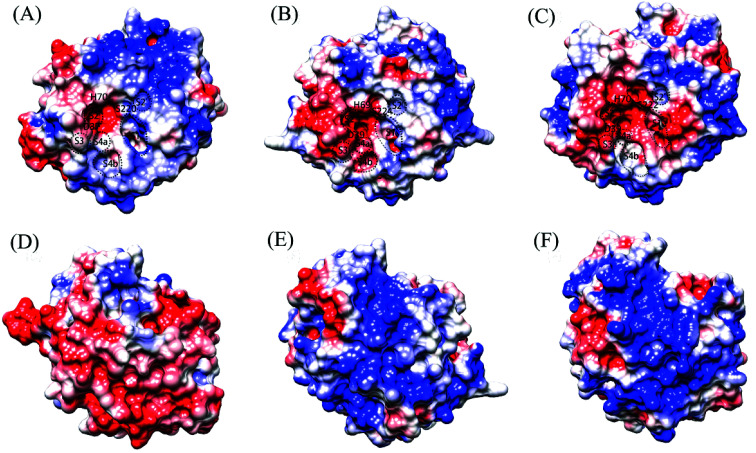
Fig. 3. Molecular surface representations showing the electrostatic surface potentials of the three proteases. (A), (B), and (C) are the front surfaces of VPR (at 283 K), PRK (at 300 K), and AQN (at 343 K), respectively; (D), (E), and (F) are their respective back surfaces. Front surface is the surface containing the catalytic active center/catalytic triad; back surface is opposite to the front surface. The positively and negatively charged surfaces are colored blue and red, respectively, and the electro-neutral (or nonpolar/hydrophobic) surface is colored white. The catalytic triad residues and approximate locations of the substrate-binding sites/pockets, i.e., S2′, S1, S2, S3, and S4a and S4b (which are sub-sites of S4), are labeled on the front surface.

Fig. 3