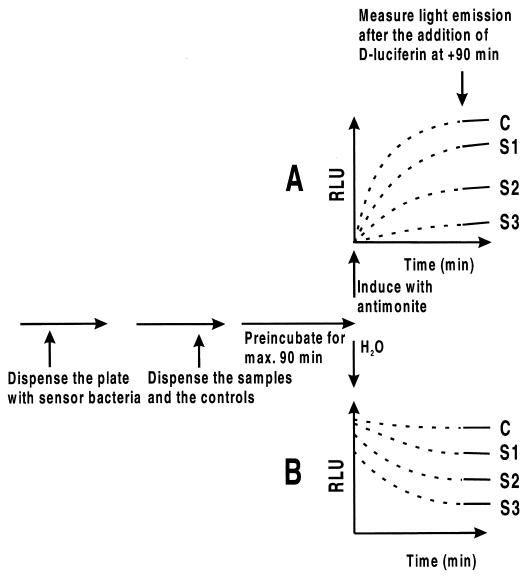
FIG. 1.
Flow chart and a schematic representation of the response curves for inducible- and constitutive-expression-based methods. Diagrams A and B show how the light emission changes in the two methods during the assay, as if the substrate for d-luciferin were already present at the beginning. In reality, the substrate is added at 90 min (dotted line changes to solid one) as calculated from the end of the preincubation period. The curves in diagram A (the inducible system) indicate that the amount of luciferase protein, shown as RLU, at time point zero min is negligible, and it start to accumulate only after the inducer is added as a function of drug samples S1 to S3 affecting the system in comparison to water control (C). On the other hand, in the constitutive expression method B, a large amount of luciferase protein is already present in the sensor cells, the activity of which is being affected more or less by samples S1 to S3 and is compared to the control (C), unaffected measurement.

