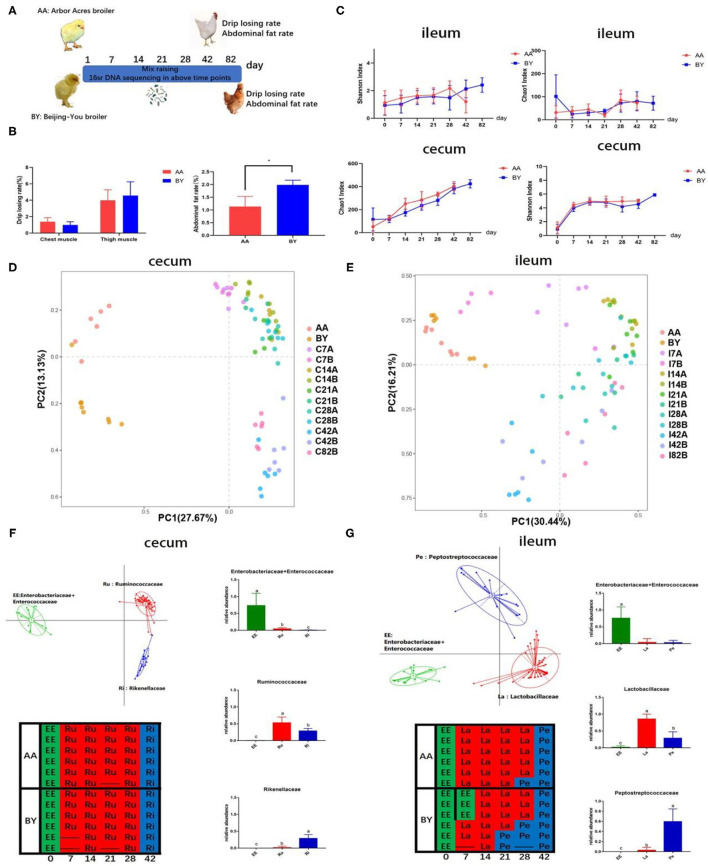
Figure 2.
The changes in the microbiota of the co-raised Arbor Acres broilers and the Beijing-You broilers. (A) Graph of microbiota development. (B) Abdominal fat deposition and water-holding capacity of meat in the AA broilers and the BY broilers. (C) Alpha diversity analysis of the Chao1 and the Shannon indexes in the Arbor Acres broilers and the Beijing-You broilers. Principal component analysis (PCA) of the changes in intestinal microbiota in (D) cecum and (E) Partitioning around medoid (PAM) of enterotypes in F and G. Graph: enterotypes and dominant bacteria; Table: the temporal distribution of intestinal microbiota types. The numbers of independent biological samples analyzed in panel B to H were AA (n = 6) and BY (n = 6) and the numbers in panels of (C–G) were AA (n = 6) at each point and BY (n = 6) at each point. Data in (B,C) are expressed as mean ± SEM. Data in (B,C) were analyzed using ANOVA followed by the Tukey's test and were considered as statistically significant at *p < 0.05 between the indicated groups. Data in (D,E) were analyzed using PCA. Data in (F,G) were analyzed using PAM. Data in (D–G) statistical tests were two-sided and the differences were considered to be statistically significant at p < 0.05.

