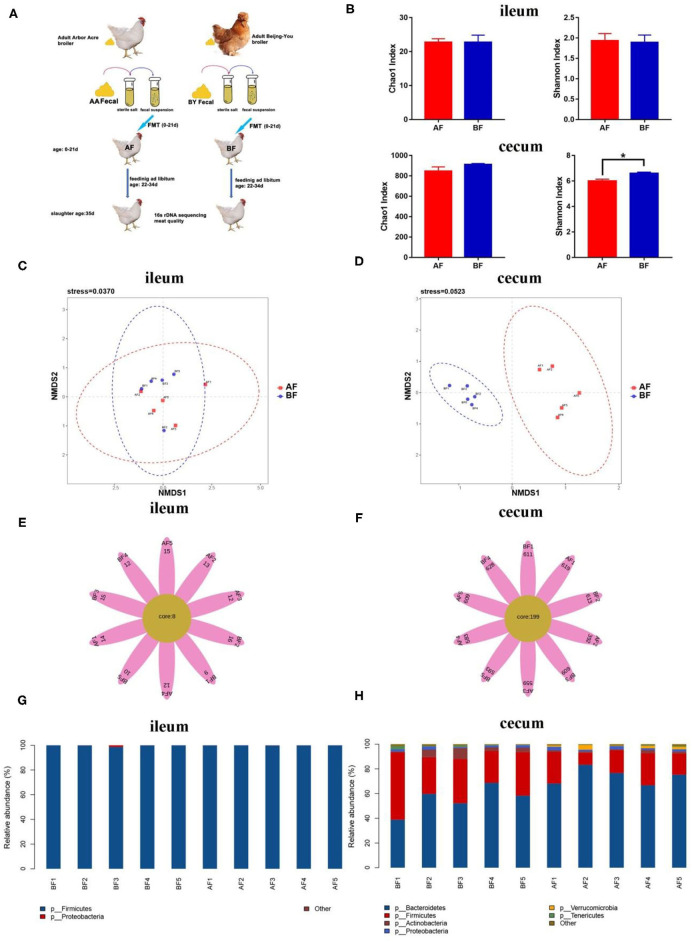
Figure 3.
16s rDNA sequencing analysis of different breeds in ileum and cecum after fecal microbiota transplantation (FMT). (A) Graph of FMT experiment. (B) Alpha diversity analysis of the Chao1 index and the Shannon index. (C,D) Scatterplot from NMDS in bacterial composition. (E,F) Venn flower diagram of core OTUs in ileum and cecum. (G,H) Intestinal microbiota structure of ileum and cecum at the phylum level. AF: Fecal transfer from the Arbor Acres broilers into the Arbor Acres broiler; BF: fecal transfer from the Beijing-You broilers into the Arbor Acres broilers. The numbers of independent biological samples analyzed in panel B to H were AF (n = 5) and BF (n = 5). Data in (B) are expressed as mean ± SEM. Data in (B) were analyzed using ANOVA, followed by the Tukey's test, and were considered as statistically significant at *p < 0.05 between the indicated groups. Data in (C,D) were analyzed using nonmetric multidimensional scaling. Data in (C–H) statistical tests were two-sided and the differences were considered to be statistically significant at p < 0.05.

