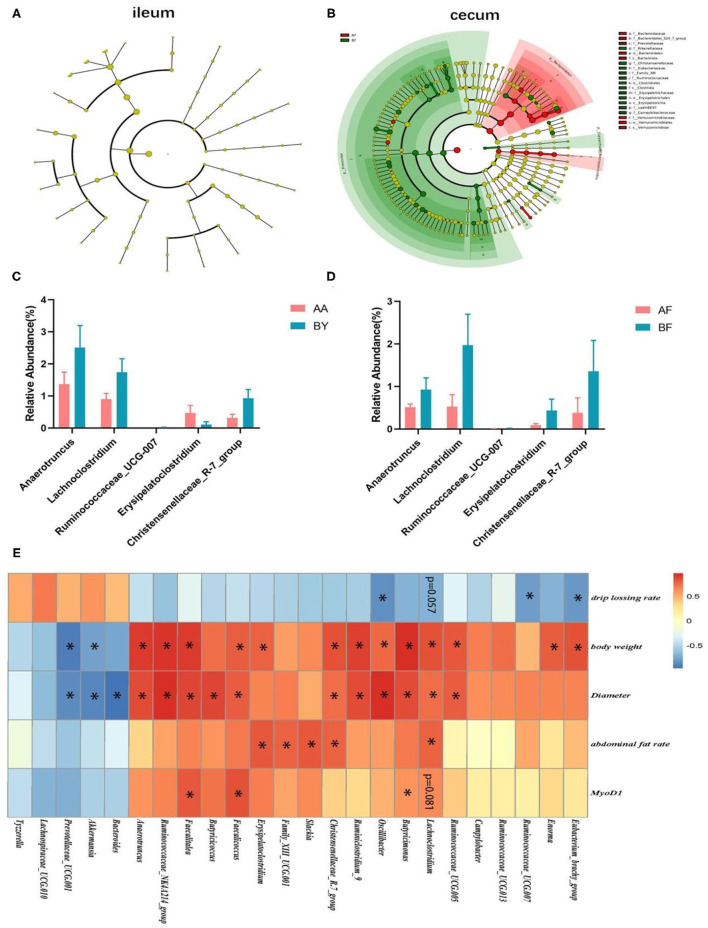
Figure 5.
Analysis of the correlation between cecum intestinal bacteria at the genus level and phenotypes. (A,B) Cladograms of different microbiota in the ileum and cecum in recipients. (C,D) Bacteria (genus level) discovered in the cecum of both the donors (C) and receptors (D); (E) The heat map of the correlation analysis between different bacteria in cecum and phenotypes. AF: Fecal transfer from the Arbor Acres broilers into the Arbor Acres broiler; BF: Fecal transfer from the Beijing-You broilers into the Arbor Acres broilers. The numbers of independent biological samples analyzed in (A–H) were AF (n = 5) and BF (n = 5). All the data are expressed as mean ± SEM. All the data were analyzed using ANOVA, followed by the Tukey's test, and were considered as statistically significant at *p < 0.05 between the indicated groups.

