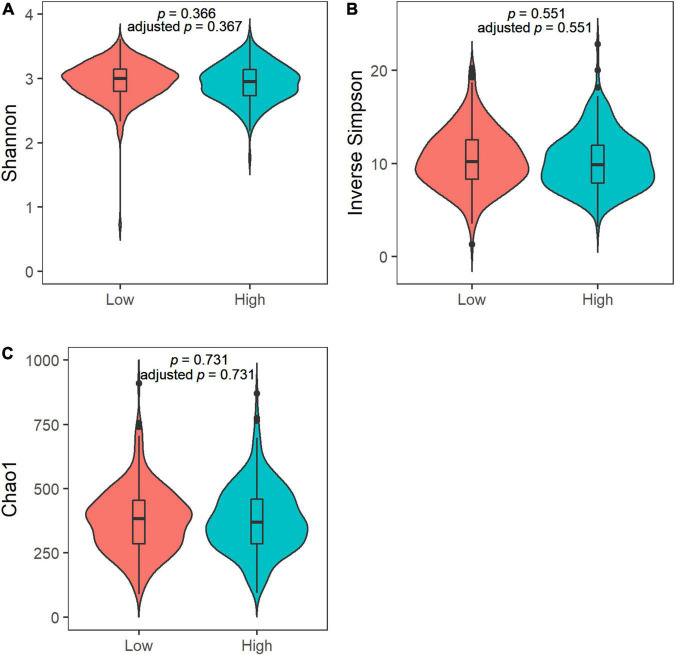
FIGURE 1.
Violin plots of the alpha diversity in the saliva microbiota in children with low (n = 227) and high (n = 226) sweet treat consumption for (A) Shannon index, (B) Inverse Simpson index, and (C) Chao1 index. Adjusted p-value based on an analysis adjusted for sex, age, waist–height ratio, and maternal socioeconomic status. Results from ANOVA and ANCOVA.

