. 2018 Sep 4;8(54):31246–31254. doi: 10.1039/c8ra05273e

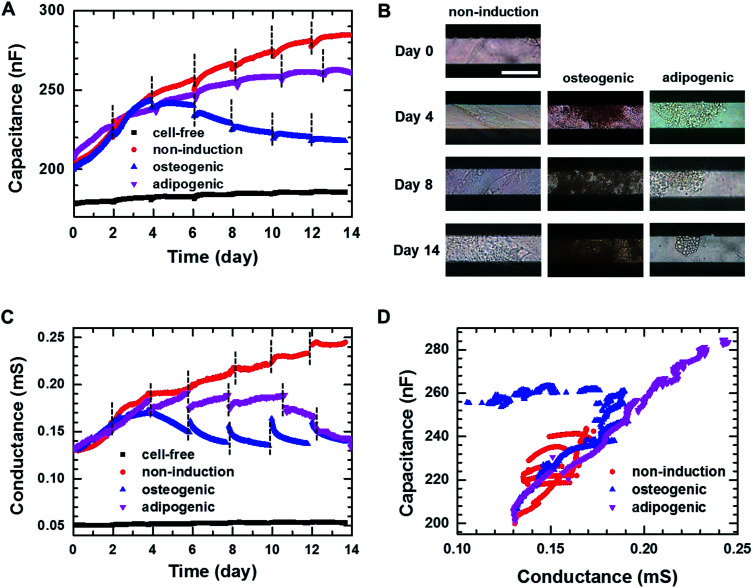
Fig. 3. (A) Capacitance measured at f = 0.5 kHz over time during 2D cell cultures in the non-induction, osteogenic induction, and adipocyte induction media. The black dashed lines indicate the time point at which cell culture media were changed. (B) Time-lapse images of the hMSCs cultured in the 2D cell culture systems on the indicated days. Scale bar, 50 μm. (C) Conductance measured at f = 0.5 kHz over time during 2D cell cultures in the non-induction, osteogenic induction and adipocyte induction media. (D) Plot of capacitance versus conductance for hMSCs obtained from the hMSCs cultured in the non-induction, osteogenic induction and adipocyte induction media.

Fig. 3