. 2018 Sep 4;8(54):31246–31254. doi: 10.1039/c8ra05273e

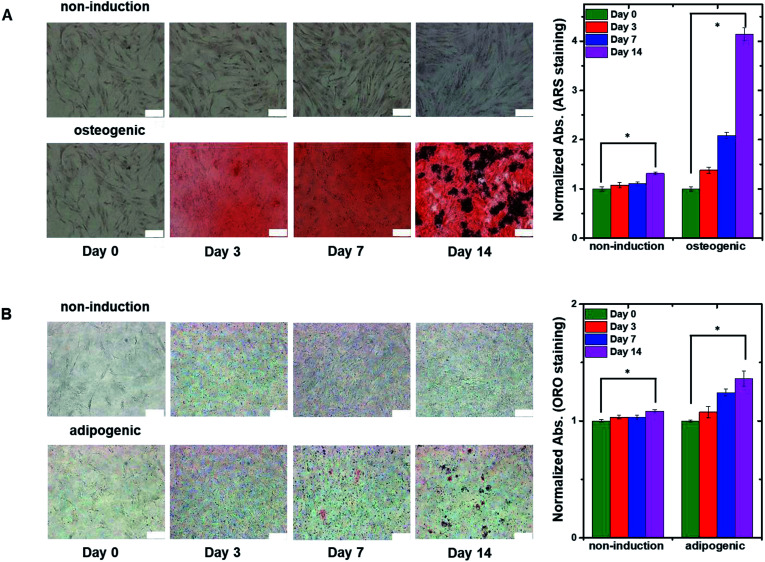
Fig. 4. (A) Time-lapse stained images of non-induced hMSCs (top panels) and osteogenic-induced hMSCs (bottom panels) cultured in the 2D cell culture system and stained with ARS to detect calcium. The plot to the right shows normalized absorption measured on the indicated days for non-induced and osteogenic induced cells stained with ARS. (B) Time-lapse stained images of non-induced hMSCs (top panels) and adipogenic induced hMSCs (bottom panels) cultured in the 2D cell culture system and stained with ORO to detect lipids. The plot to the right shows normalized absorption measured on the indicated days for non-induced and adipogenic-induced cells stained with ORO. The data in the plots are shown as the means ± standard deviations (n = 5). Scale bar, 200 μm. *P < 0.001.

Fig. 4