. 2018 Sep 4;8(54):31246–31254. doi: 10.1039/c8ra05273e

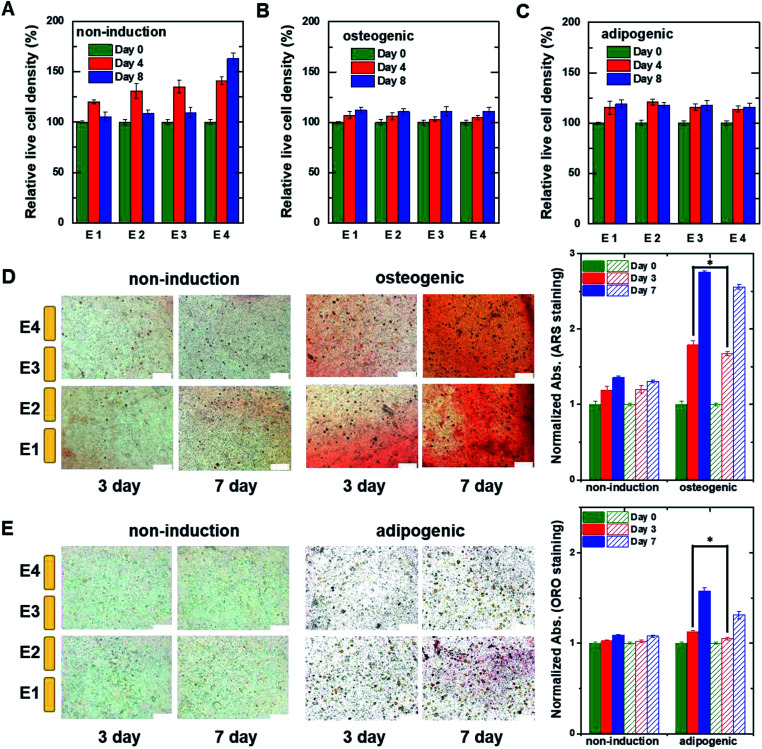
Fig. 6. The relative live cell density of hMSCs measured at different heights within the 3D cell culture system. The hMSCs were cultured with (A) non-induction, (B) osteogenic induction, and (C) adipogenic induction media on the indicated days. The live cell densities were estimated from fluorescent images of hMSCs encapsulated in hydrogel that was sliced horizontally and stained with ethidium homodimer-1/calcein AM (Fig. S7). The data were normalized using the optical density measured on day 0. Time-lapse stained images of hMSCs encapsulated in hydrogel that was sliced horizontally and stained with (D) ARS to detect calcium or (E) ORO to detect lipids. The hMSCs were grown in the 3D cell culture system in non-induction (top) and osteogenic induction media (bottom) for the indicated times. The plots to the right show normalized absorption for non-induced and osteogenic-induced cells stained with ARS or adipocyte-induced cells stained with ORO. The filled and dashed bars represent the data obtained from the lower region (E1 and E2) and the upper region (E3 and E4), respectively. Data are shown as the means ± standard deviations (n = 5). Scale bar, 200 μm. *P < 0.001.

Fig. 6