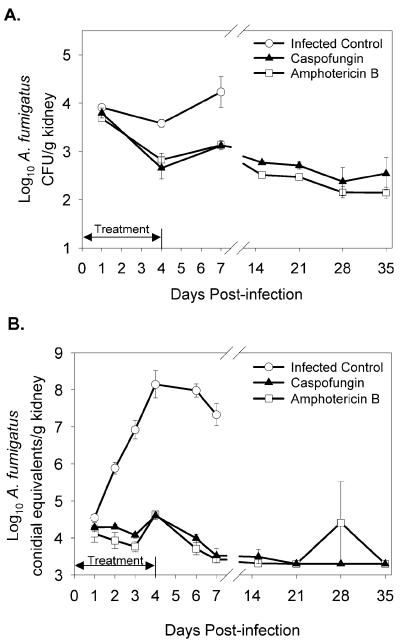
FIG. 4.
Effect of caspofungin or AmB on A. fumigatus kidney burden versus that in infected control mice. Animals were infected as described in the legend to Fig. 2. Therapy was administered as described in Materials and Methods. Values (mean ± standard error of three mice unless noted) are log10 CFU per gram of kidney (A) or log10 CE per gram of kidney (B) in the presence of caspofungin therapy (▴), AmB therapy (□), or no therapy (○). The double-headed arrow indicates the duration of the treatment period. On days 4 and 6, five mice from the nontreated group were used for qPCR analysis; on day 35, two mice from the AmB-treated group were used.

